On this page
1. Getting Started
Create an account, install the Chrome extension, and record your first workflow in under five minutes.
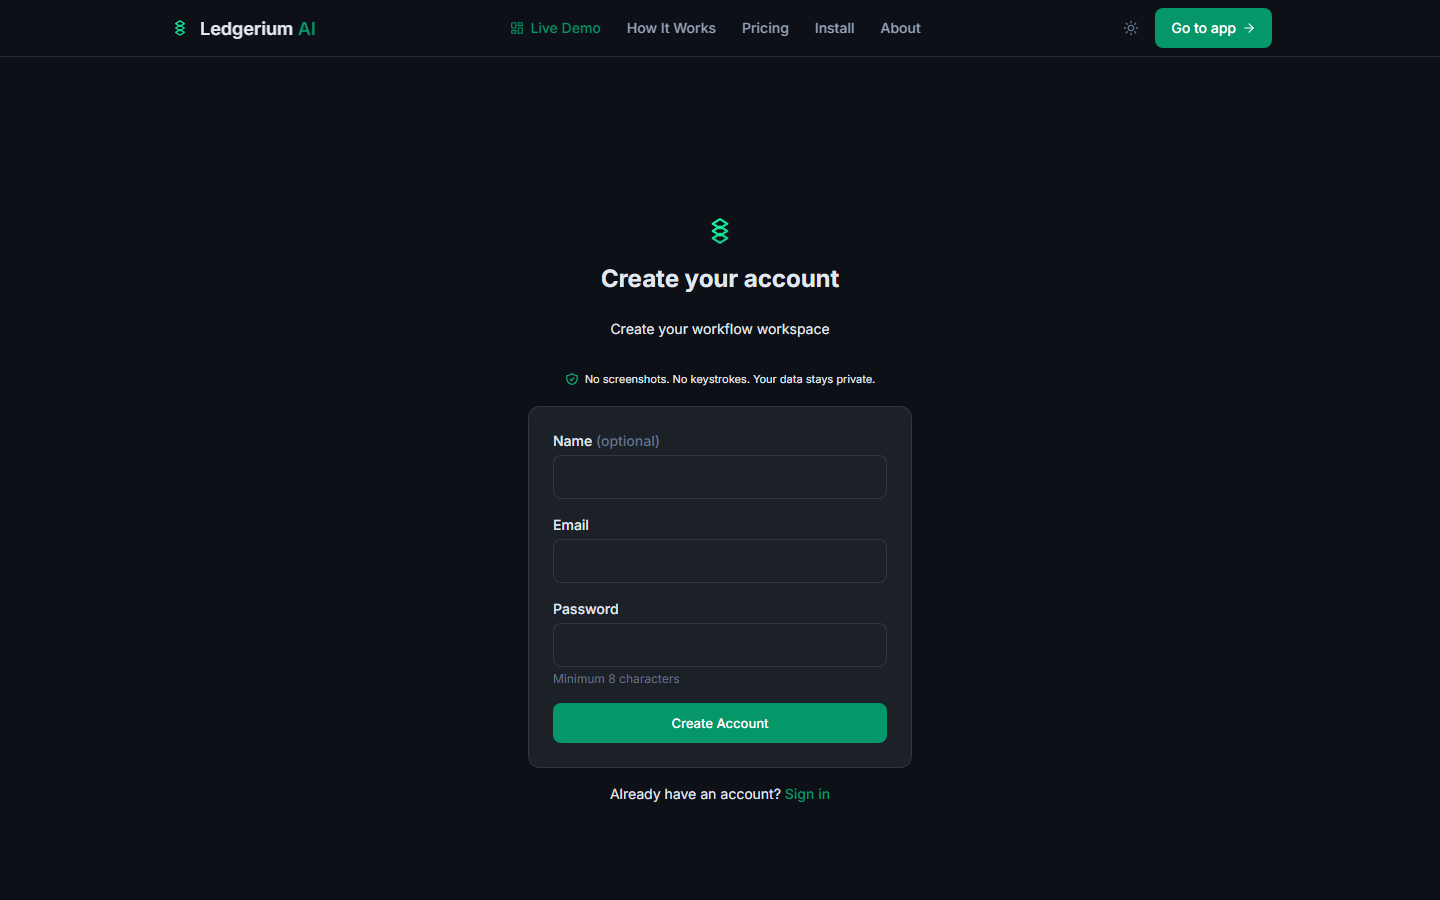
1.1 Creating your account
Ledgerium AI is free to start — no credit card required.
- 1Go to ledgerium.ai/signup.
- 2Enter your name (optional), email address, and a password (minimum 8 characters).
- 3Click Create Account.
- 4You are signed in and taken to your dashboard.
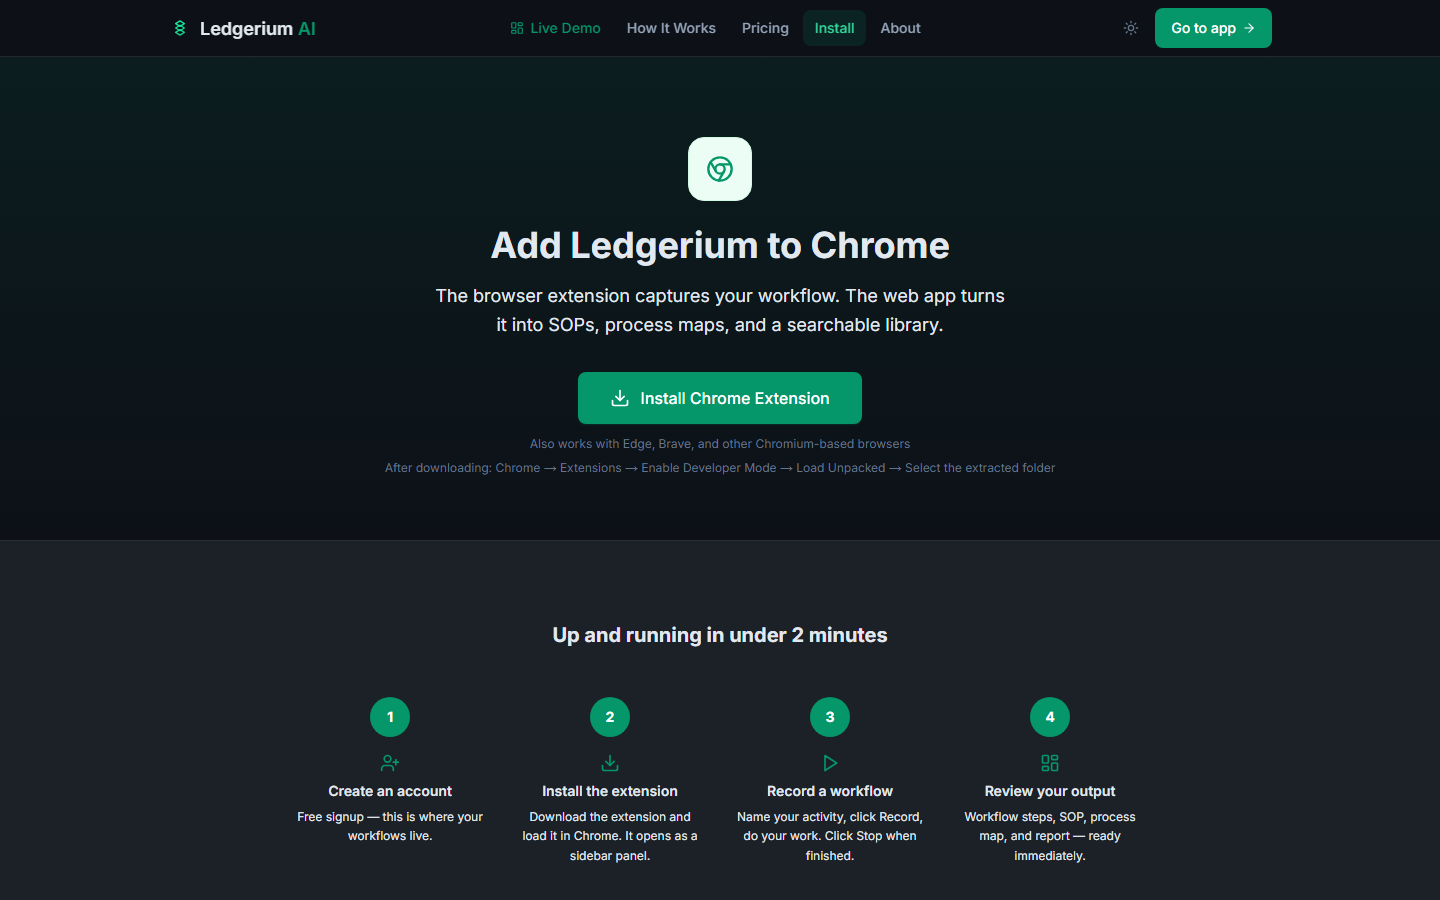
1.2 Installing the Chrome extension
The Ledgerium AI Chrome extension is what records your workflows. You install it once, and it runs alongside your normal browser activity whenever you choose to record.
Step 1 — Download the extension
- 1From the footer or product page, click Get Extension, or go to ledgerium.ai/install.
- 2Click Install Chrome Extension.
- 3A
.zipfile downloads to your computer.
Step 2 — Enable Developer Mode in Chrome
Because the extension is installed directly (sideloaded), Chrome requires Developer Mode to be enabled.
- 1In Chrome, navigate to
chrome://extensions. - 2Toggle Developer mode on using the switch in the top-right corner.
Step 3 — Load the extension
- 1Unzip the downloaded file to a permanent folder on your computer.
- 2On the
chrome://extensionspage, click Load unpacked. - 3Select the folder you unzipped.
- 4The Ledgerium AI extension appears in your extension list.
Step 4 — Pin the extension
- 1Click the puzzle-piece icon in the Chrome toolbar (top right).
- 2Find Ledgerium AI in the list.
- 3Click the pin icon so Ledgerium AI stays visible in your toolbar.
1.3 Connecting the extension to your account
The extension syncs recordings to your web app account automatically once you provide an API key.
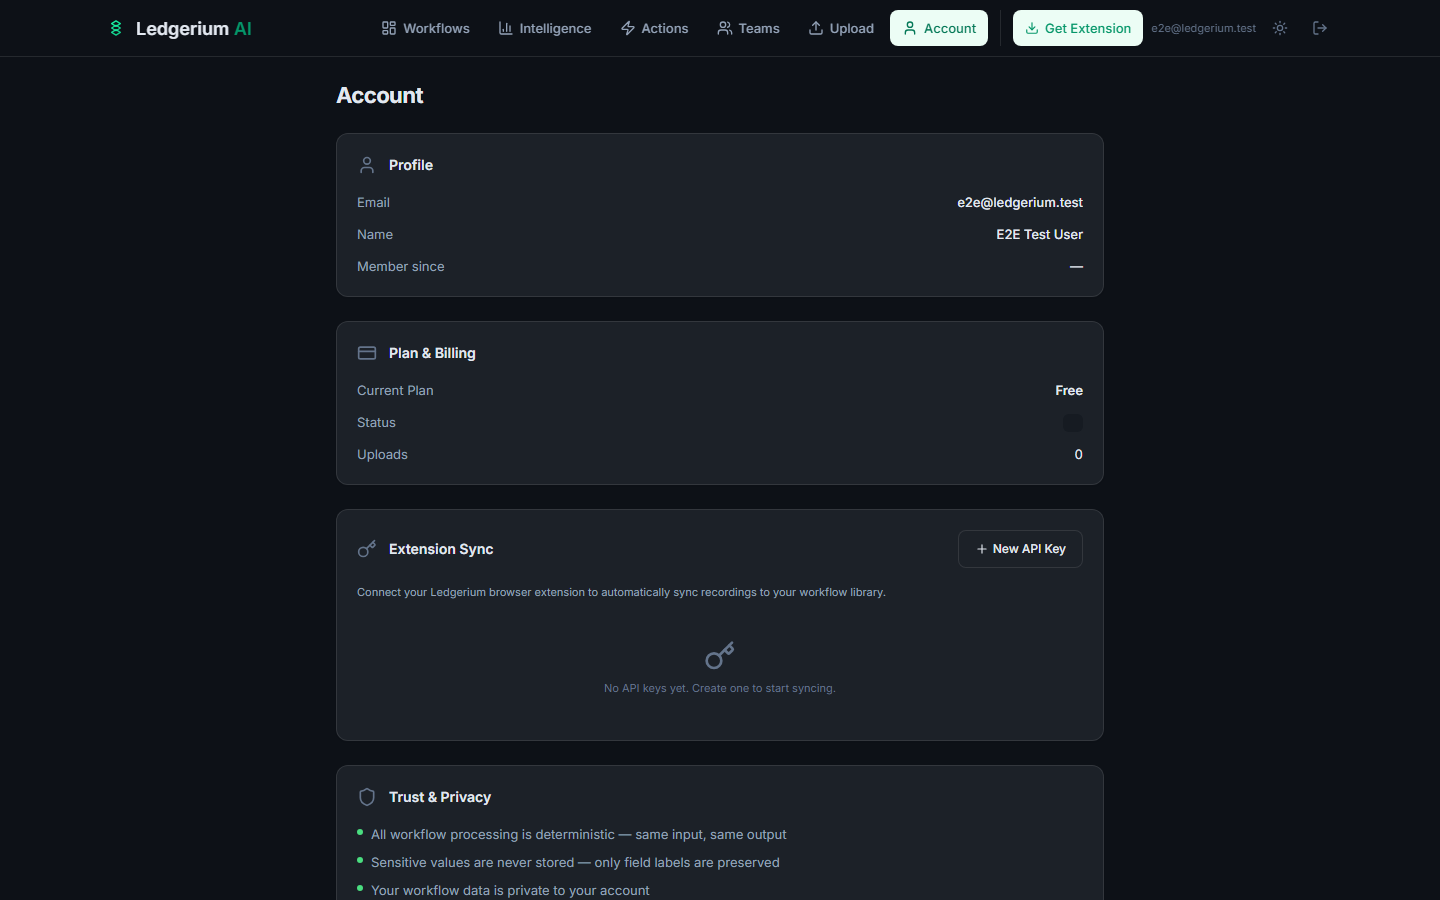
Generate an API key
- 1In the web app, click Account in the top navigation bar.
- 2Scroll to the Extension Sync section.
- 3Click + New API Key.
- 4Copy the key immediately — it is shown only once.
- 5Note the Sync URL displayed on the page (e.g.,
https://ledgerium.ai/api/sync).
Configure the extension
- 1Click the Ledgerium AI icon in your Chrome toolbar to open the side panel.
- 2Click Sync Settings at the bottom of the panel.
- 3Paste the Sync URL and your API Key into the fields.
- 4Click Save.
The extension will now automatically upload recordings to your account when you stop recording.
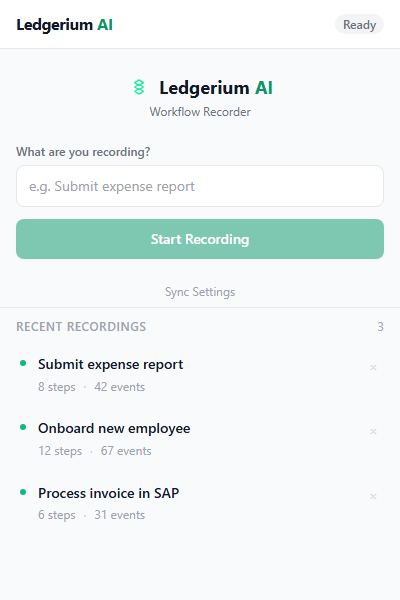
1.4 Recording your first workflow
- 1Navigate to the web application or browser tool you want to document.
- 2Click the Ledgerium AI icon in your Chrome toolbar to open the side panel.
- 3Enter a descriptive name in the Workflow name field (e.g., “Process a new support ticket”).
- 4Click Record.
- 5A recording indicator confirms the session is live.
- 6Perform your workflow as you normally would.
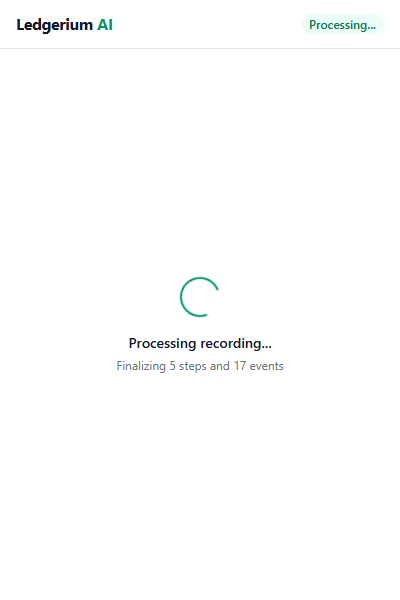
- 7When finished, click Stop.
The extension finalizes the session and, if sync is configured, uploads it to your account automatically. The workflow appears in your dashboard within seconds.
1.5 Uploading a workflow manually
If you recorded a workflow without sync configured, you can upload the JSON file directly.
- 1In the web app, click Upload in the navigation bar.
- 2Drag and drop your
.jsonfile onto the upload area, or click to browse. - 3The platform validates the file and processes it through the deterministic engine.
- 4On success, you see the workflow title, step count, and detected tools.
- 5Click View Workflow to open it.
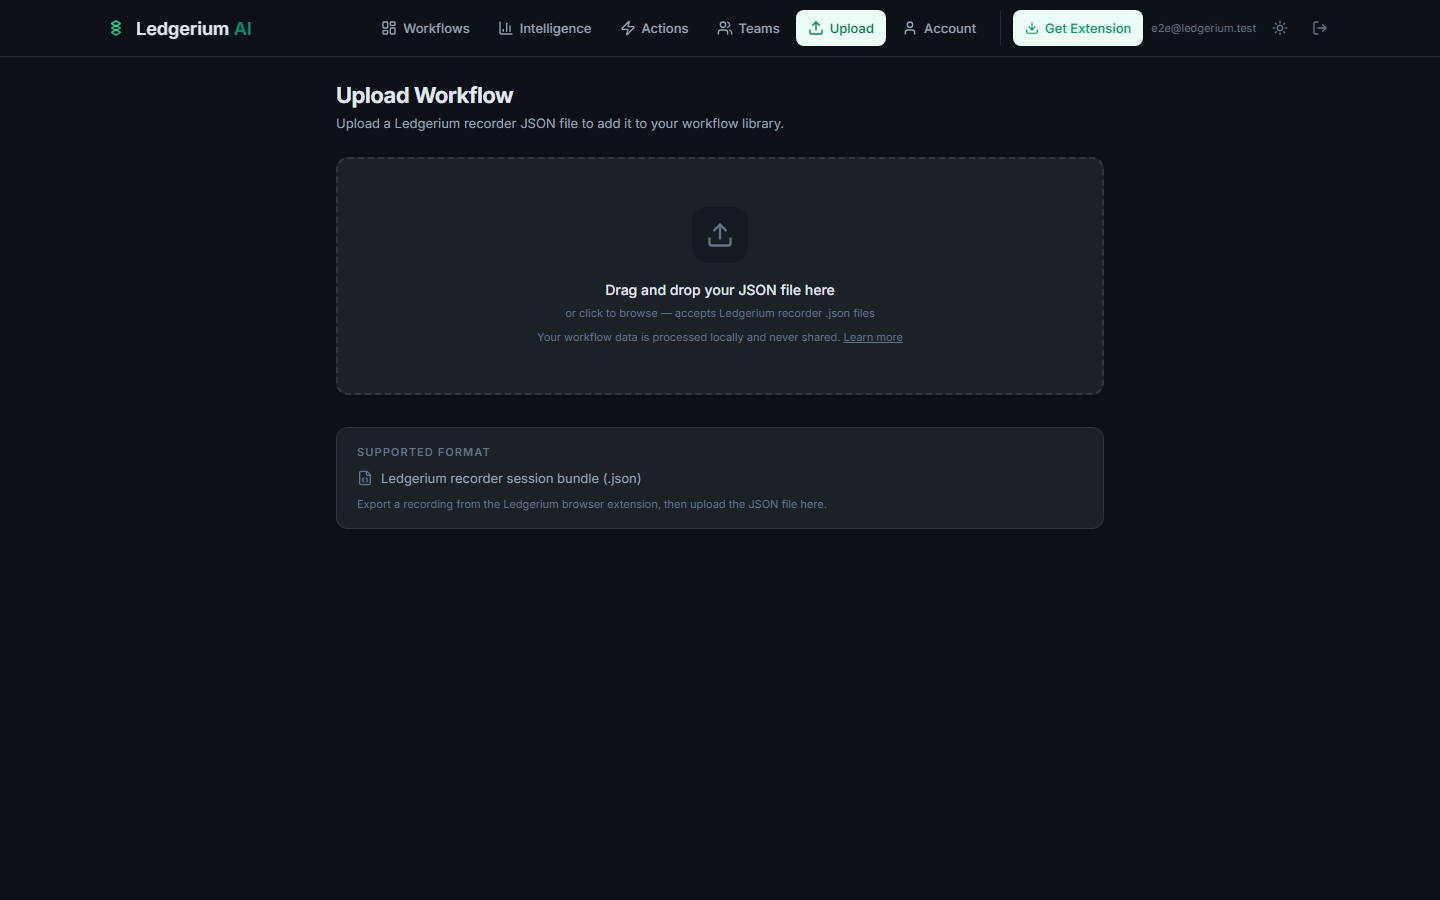
.json files exported by the Ledgerium AI recorder (maximum 10 MB). The file is validated against the session bundle schema before processing begins.1.6 Loading a sample workflow
If you want to explore the platform before recording anything:
- 1Go to your Dashboard.
- 2Click Try a sample workflow.
- 3A pre-built workflow loads into your library with all tabs and outputs populated.
This is a good way to see what a fully processed workflow looks like before recording your own.
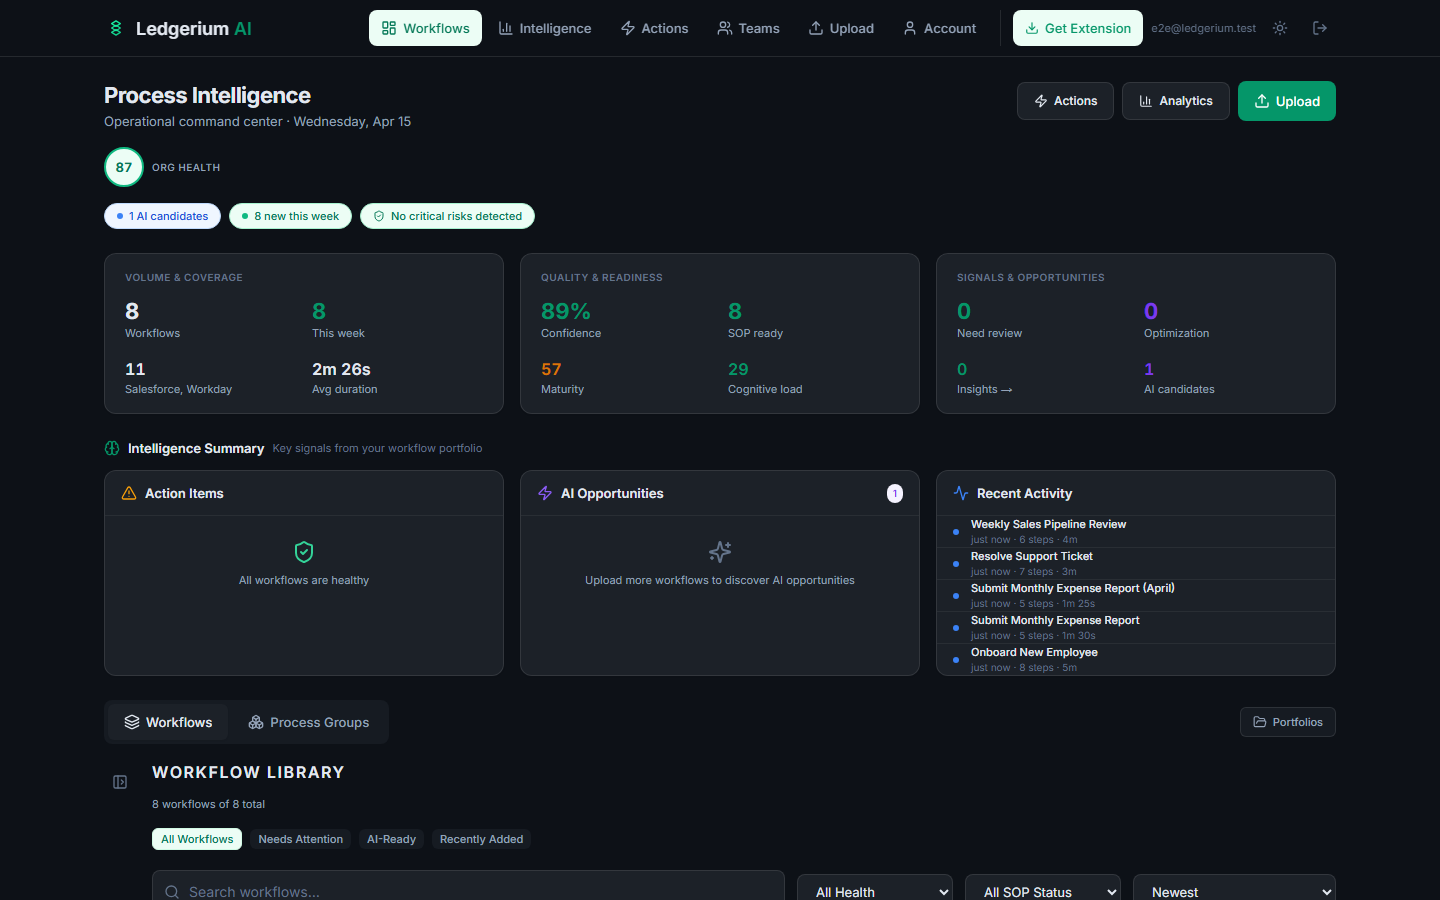
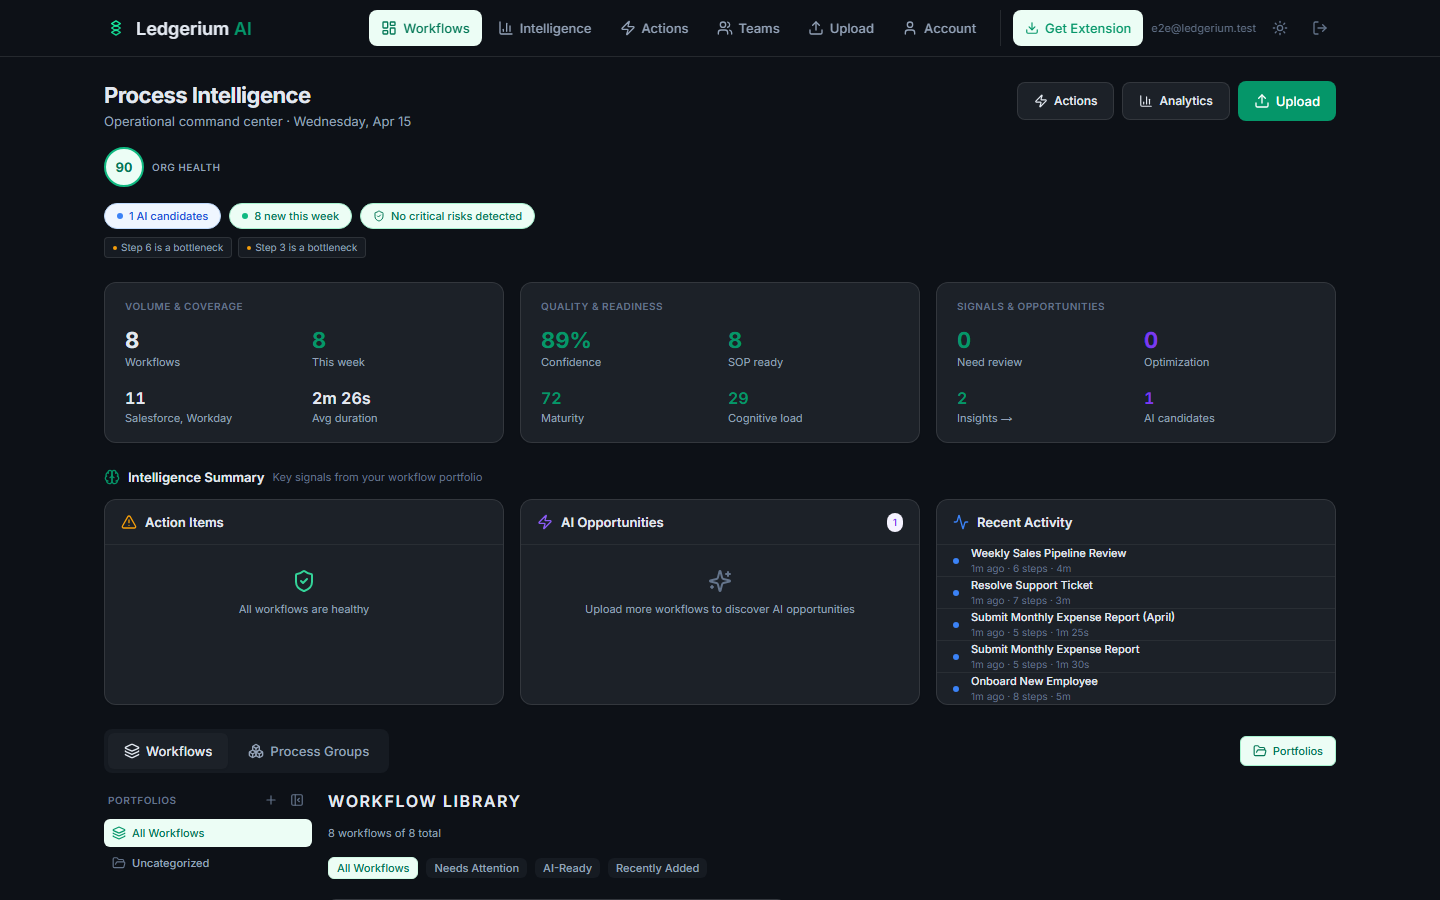
2. Dashboard & Workflow Library
The dashboard is your home base. It shows all your workflows and gives you quick access to search, filter, organize, and navigate to any recording.
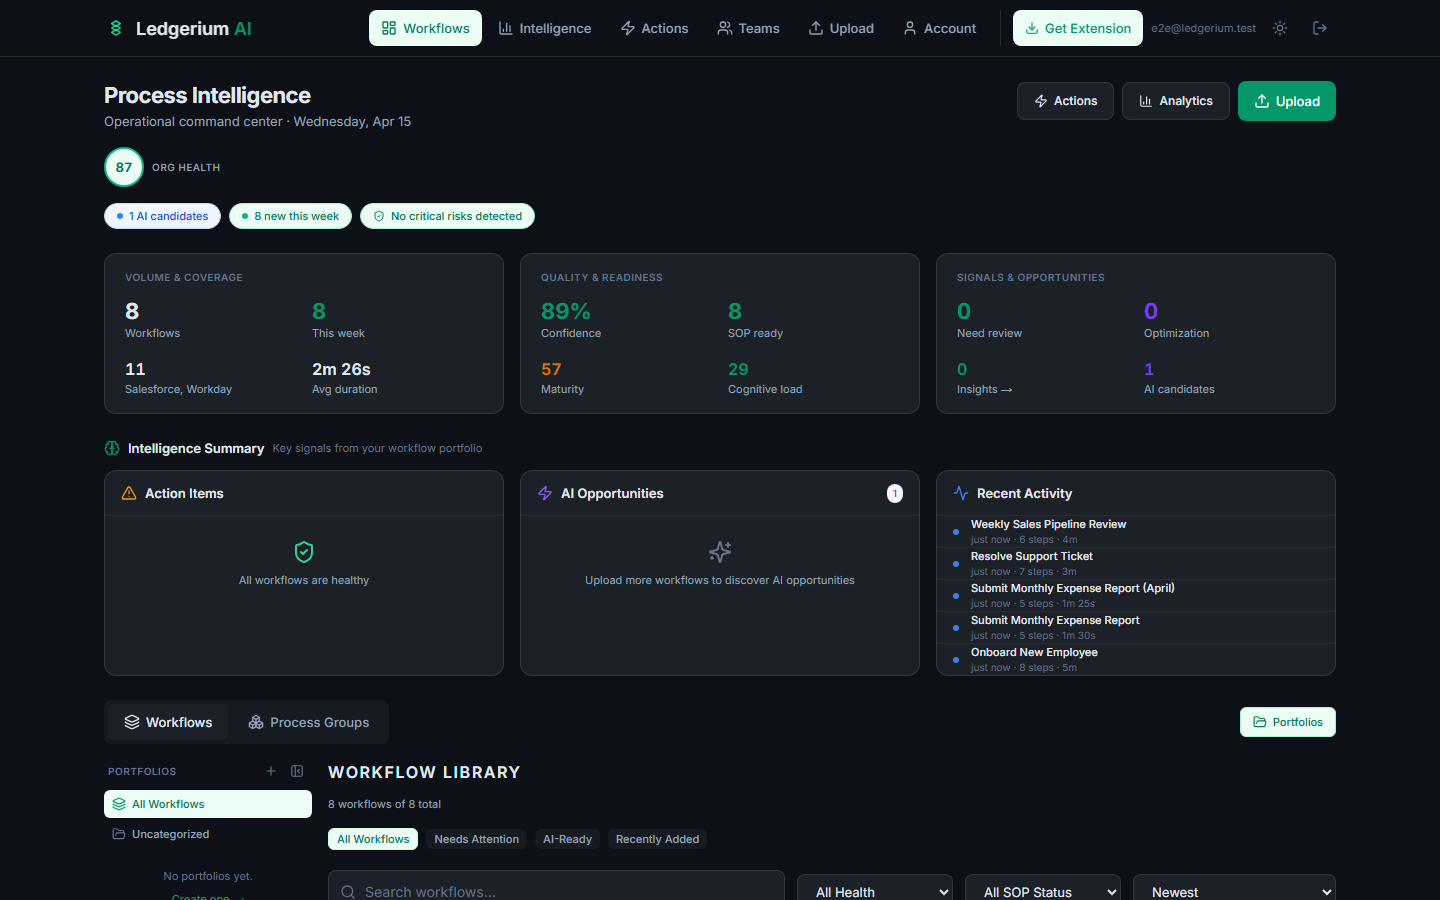
2.1 Dashboard layout
The dashboard is split into two major areas:
Process Intelligence summary (top)
When you have enough workflows, the dashboard shows an intelligence summary with:
| Card | What it shows |
|---|---|
| Sources & Workflows | Total workflows and data sources in your library |
| Steps & Duration | Combined step count and average duration across workflows |
| SOP & Confidence | SOP readiness score and average confidence percentage |
| Intelligence Summary | Count of active items, action items, and recent findings |
| AI Opportunities | Number of workflows with automation potential |
| Recent Activity | Latest workflow additions and changes |
Workflow Library (bottom)
The library shows all your workflows as a filterable list with quick-access metadata on each row. Toggle between Workflows view and Process Groups view using the view selector above the list.
2.2 Searching and filtering
Use the toolbar above the workflow list to find specific workflows.
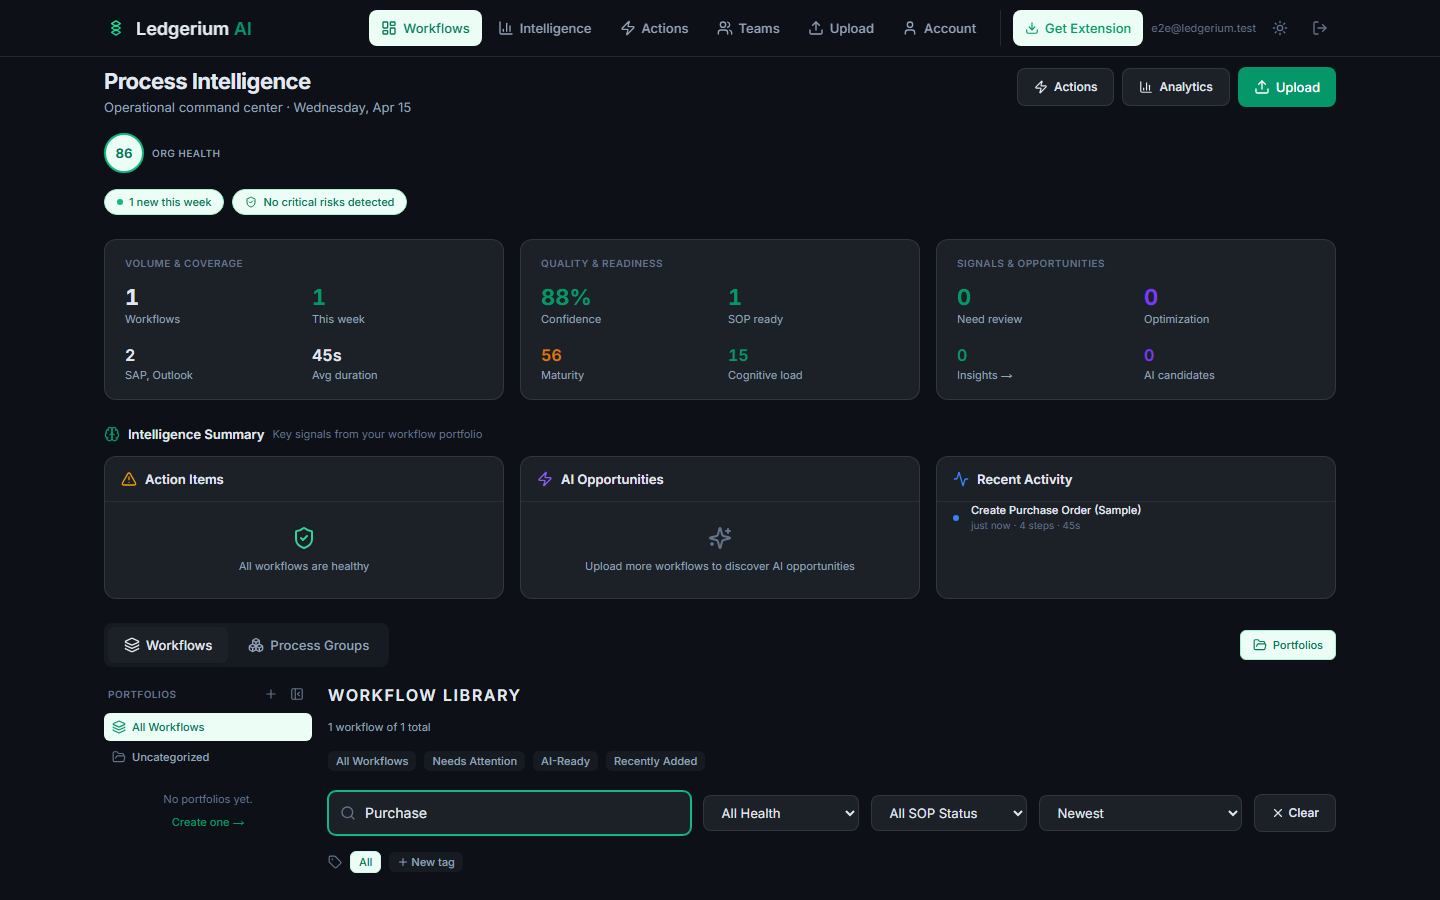
Search bar
Type any part of a workflow title. Results update as you type.
Preset quick-filter buttons
| Button | Shows |
|---|---|
| All | Your complete library |
| AI Health | Workflows with health status indicators |
| AI SOP Status | SOP readiness filtering |
| Recently Added | Workflows from the last 7 days |
Sort options
Click the sort dropdown to order workflows by date added, name, step count, or duration.
2.3 Workflow cards
Each row in the workflow library shows:
- Title — the workflow name from the recording.
- Tool badges — applications detected (e.g., Salesforce, Workday, Stripe).
- Confidence badge — the engine’s certainty in step segmentation (green = high, amber = moderate, red = low).
- Step count & duration — number of detected steps and total time.
- Date — when the recording was created.
- Favorite star — click to pin a workflow to the top of your library.
2.4 Portfolios
Portfolios are folders that let you group related workflows — for example, “Onboarding Workflows,” “Finance Processes,” or “Support Playbooks.”
Creating a portfolio
- 1In the sidebar, click the + icon next to “Portfolios.”
- 2Enter a name for the portfolio.
- 3Click Create.
Navigating portfolios
- Click any portfolio name in the sidebar to filter the dashboard to only workflows in that group.
- Portfolios can be nested to create a multi-level folder structure.
3. Workflow Detail View
Click any workflow from the dashboard to open its detail page. This is where you access all the outputs generated from a recording.
Header
The header at the top of every workflow detail page shows:
- Workflow title — editable by clicking the pencil icon next to it.
- Metadata row — step count, total duration, phase count, confidence score, view count, and creation date.
- Tool badges — all applications detected during the recording (e.g., Salesforce, Google Sheets).
- Export buttons — Report, SOP, and JSON download buttons in the top-right corner.
- Share button — enable a public link for this workflow.
Tab bar
Below the header, eight tabs give you different views of the same recording:
Workflow · SOP · Report · Insights · Interpretation · Intelligence · AI Agents · Evidence
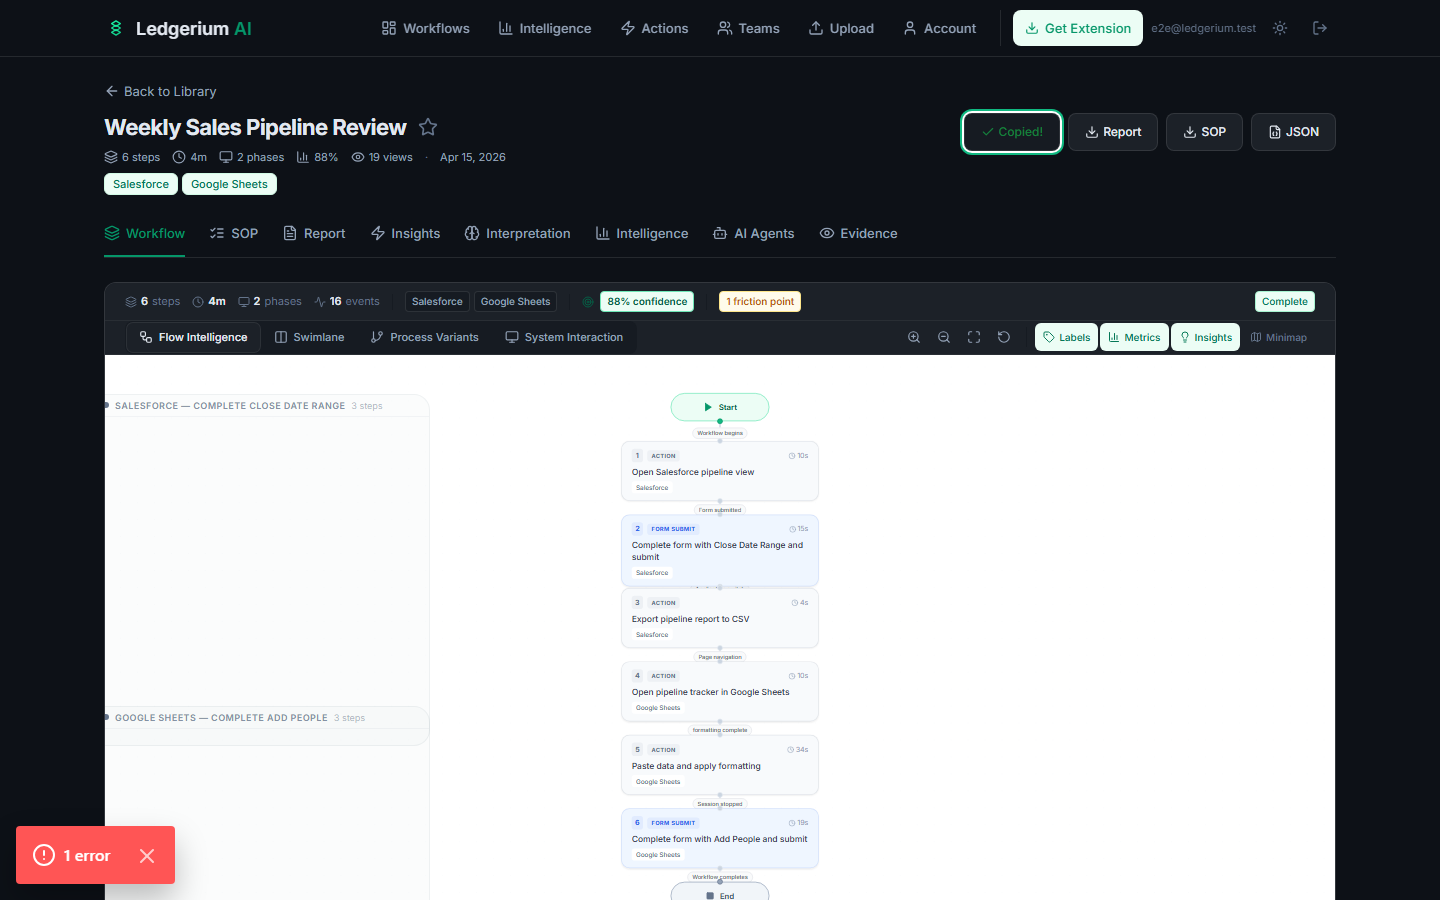
3.1 Process Map (Workflow tab)
The Workflow tab renders your recorded process as an interactive visual map. It has multiple display modes selectable from the sub-toolbar.
Flow Intelligence mode (default)
Flow Intelligence shows the step-by-step execution as a connected node graph.
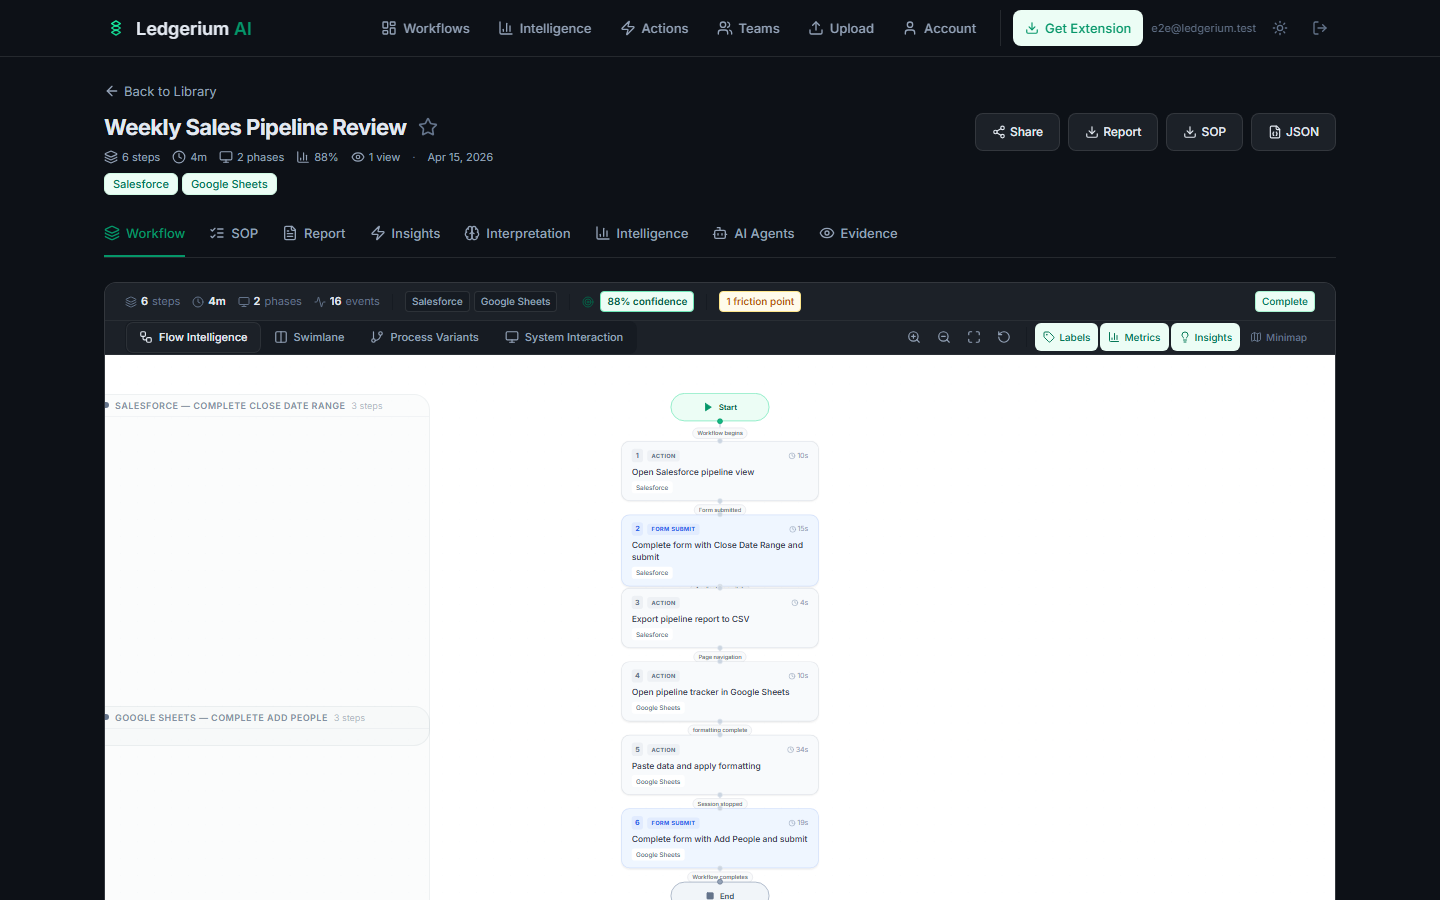
- Phases — steps are grouped into phases (e.g., “Initiation,” “Processing,” “Completion”) shown as labeled sections.
- Step nodes — each node shows the step title, category badge, and duration.
- Decision nodes — branching points appear as diamond shapes.
- Interactive canvas — scroll to zoom, drag to pan.
Toolbar controls
| Toggle | What it does |
|---|---|
| Flow Intelligence | Default step-sequence view |
| Swimlane | Steps organized by system/application |
| Process Variants | Overlays execution paths from multiple recordings |
| System Interaction | Focus on cross-system integration patterns |
Swimlane mode
Swimlane view reorganizes the workflow into horizontal lanes, one per detected system or application.
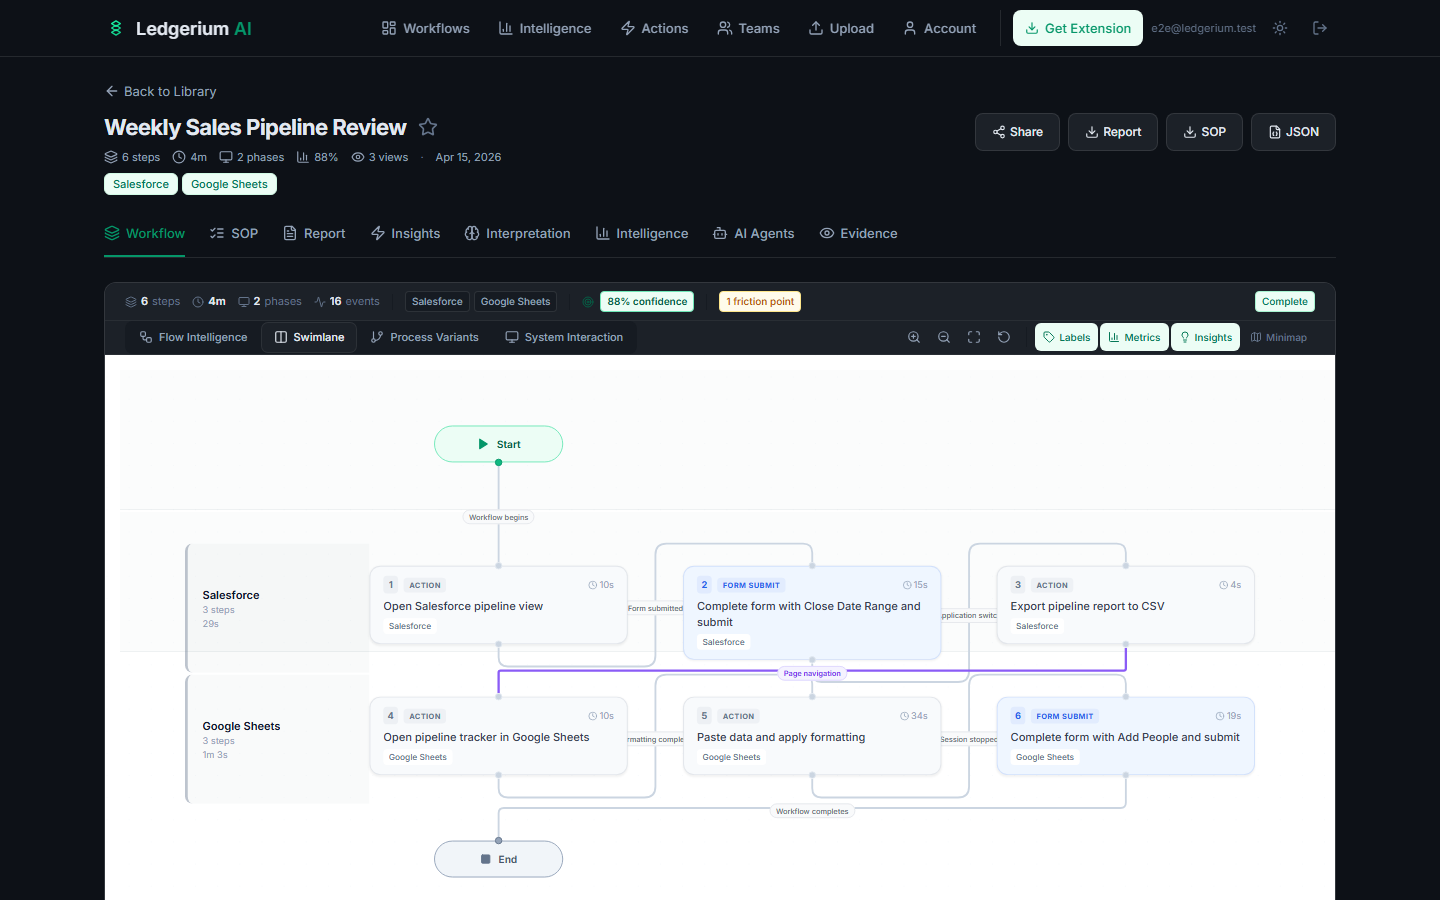
- Each lane represents a different tool (e.g., Salesforce, Google Sheets).
- Handoff edges — transitions between systems are shown as curved arrows crossing lane boundaries.
- Best for workflows that move across multiple tools.
Inspector panel
Click any node on the canvas to open the Inspector panel on the right. The Inspector shows the step title, category, duration, systems, operational definition, expected outcomes, and any warnings.
3.2 SOP Tab
The SOP tab presents the Standard Operating Procedure derived from the recording. Every instruction traces back to an observed event — no content is fabricated.
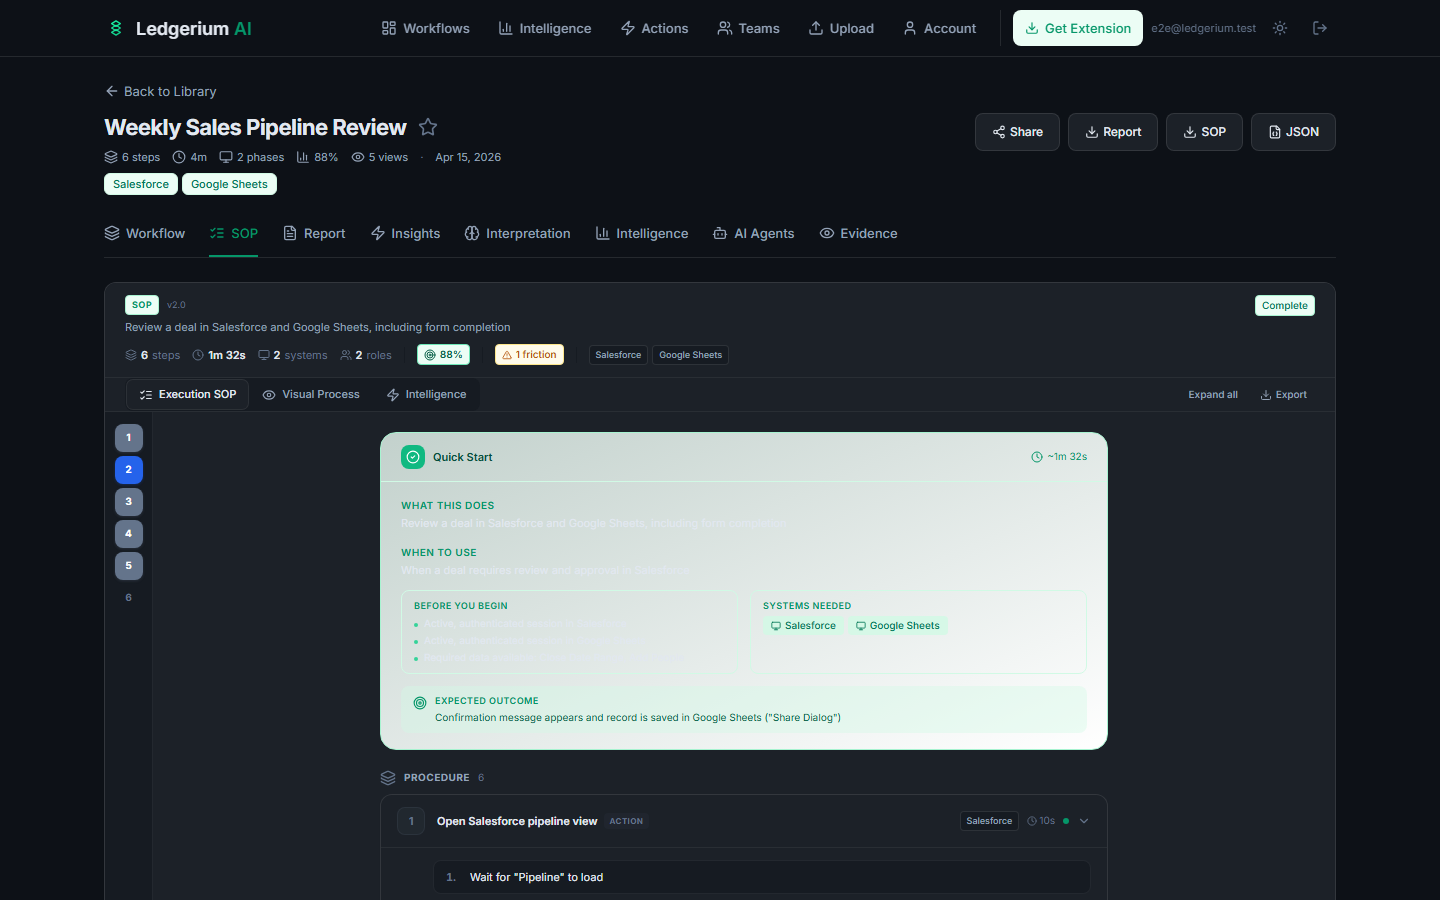
The SOP has three sub-modes:
| Mode | Description |
|---|---|
| Execution SOP | The primary reference — numbered steps with instructions, expected outcomes, duration, and system badges. |
| Visual Process | Steps grouped by phase with system context alongside each step. |
| Intelligence | Overlays friction points, decision criteria, rework loops, and optimization opportunities on the SOP. |
Each step card in the Execution SOP shows:
- Step number and title — sequential position and what the step accomplishes.
- Category badge — the type of action (color-coded: Navigation, Form Submit, Data Entry, etc.).
- Operational definition — a clear instruction describing exactly what to do.
- Expected outcome — what should happen when the step is complete.
- Duration and related systems.
- Warnings — flags for sensitive data, non-standard behavior, or low-confidence segments.
Use Expand All to open every step at once, or Collapse All to return to the summary view.
3.3 Report Tab
The Report tab provides a structured summary formatted for sharing with stakeholders or managers who need an overview rather than full operational detail.
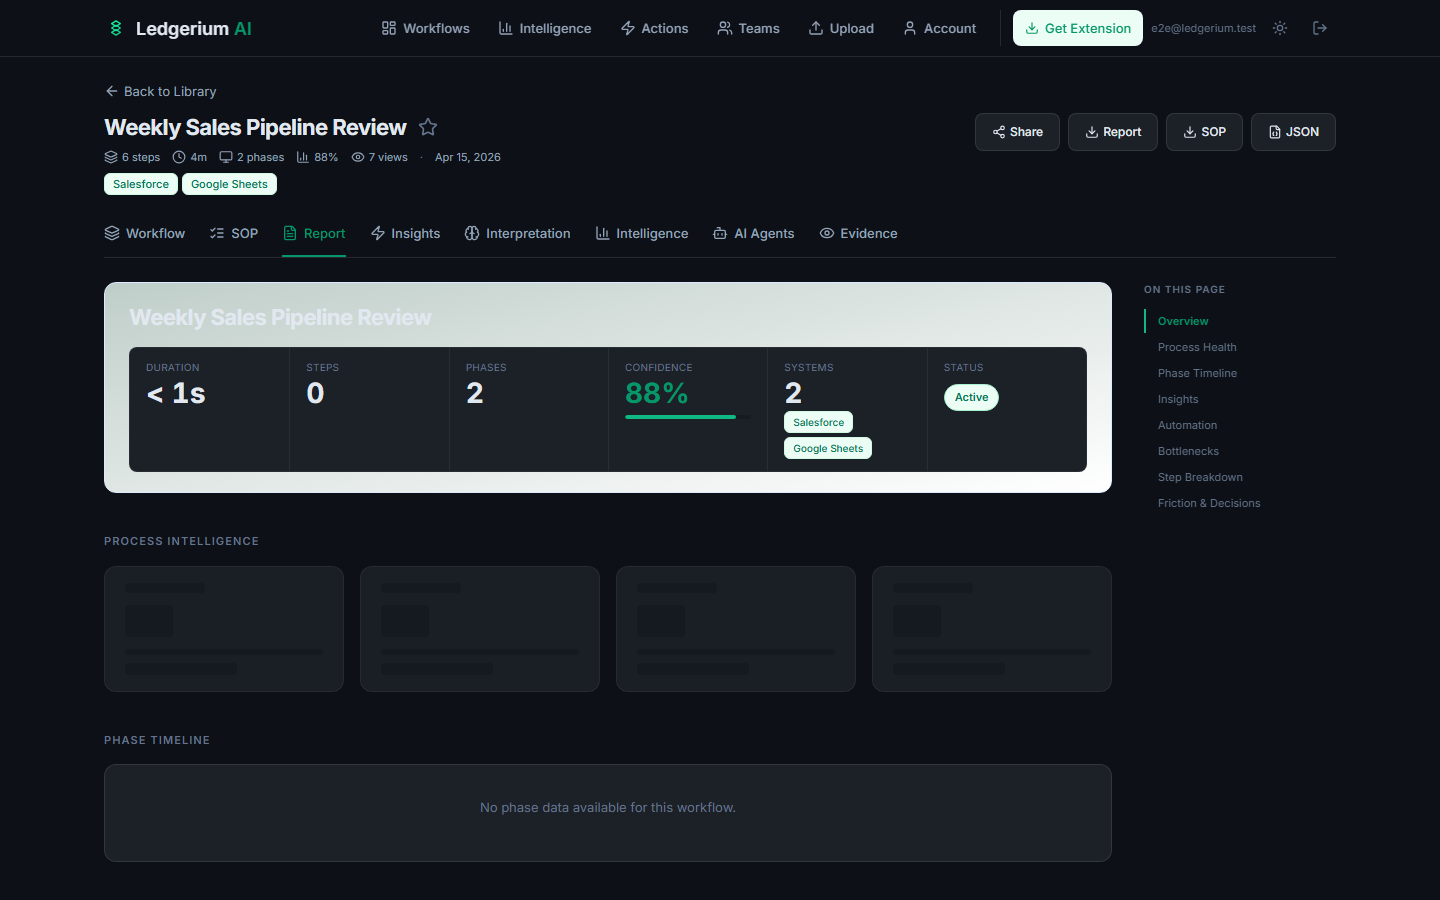
Health scorecard
A 0–100 score with color interpretation:
| Score | Status |
|---|---|
| 80–100 | Healthy — process is well-structured and consistent |
| 60–79 | Moderate — some friction or variance detected |
| 40–59 | Needs attention — notable issues present |
| 0–39 | Critical — significant problems detected |
Key metrics
- Total duration and average step duration
- Step count and distribution across phases
- Bottleneck count and friction points
- System interaction count
3.4 Insights Tab
The Insights tab surfaces specific, actionable findings from the process analysis, categorized by severity.
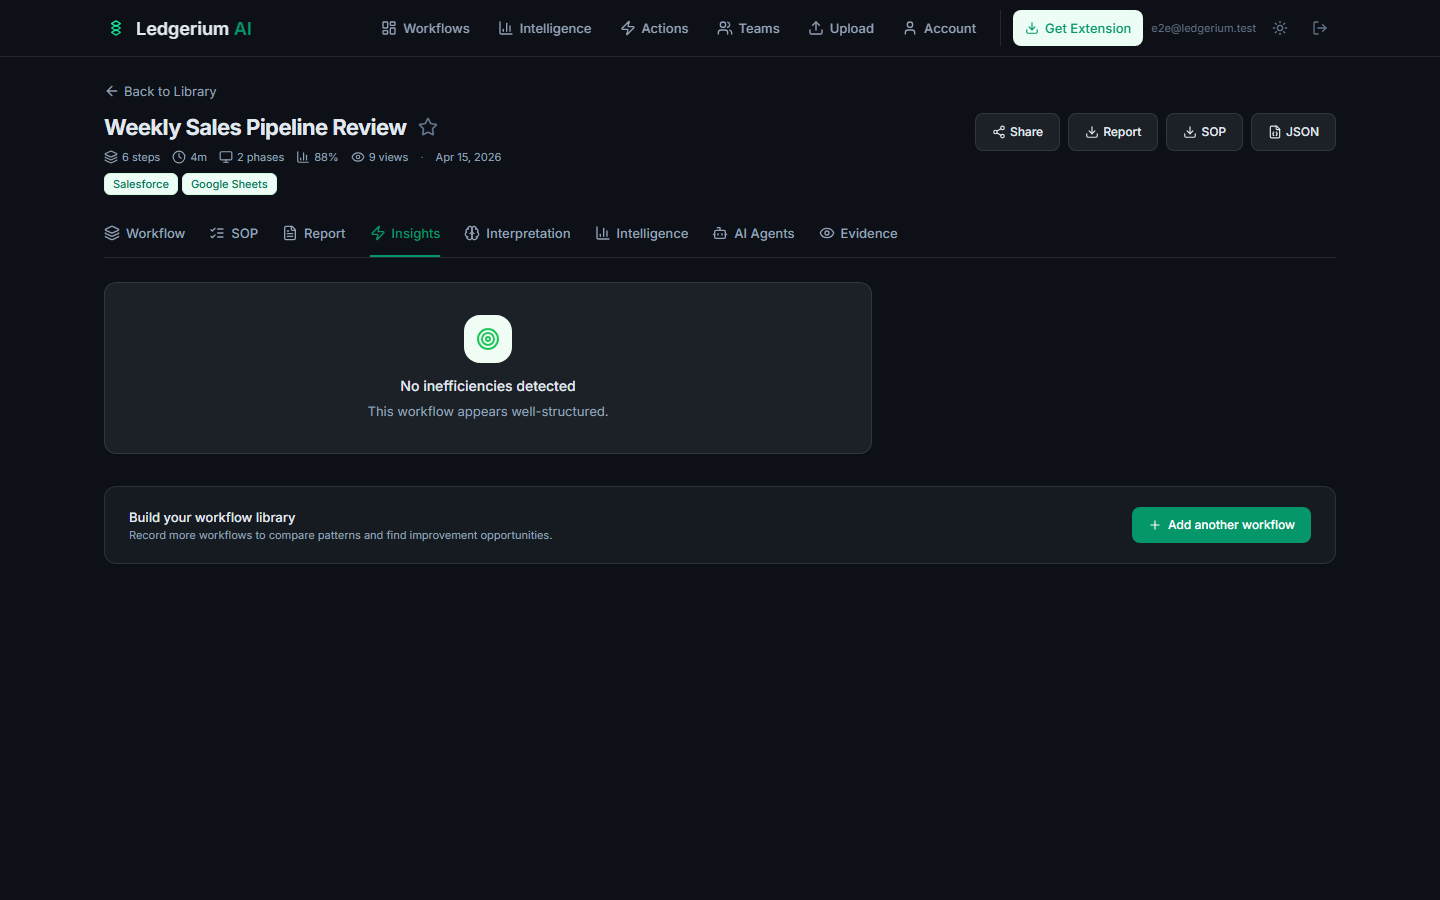
Severity levels
| Severity | Color | Meaning |
|---|---|---|
| Critical | Red | A significant issue that affects process reliability |
| Warning | Amber | A notable issue worth addressing |
| Info | Blue | An observation or opportunity, not urgent |
Each insight card shows: title, type (Bottleneck, Friction, Rework, Variance, Anomaly), explanation with data points, affected steps, and a concrete recommendation.
3.5 Interpretation Tab
The Interpretation tab provides an analytical summary of the process structure, written for process owners and improvement leads.
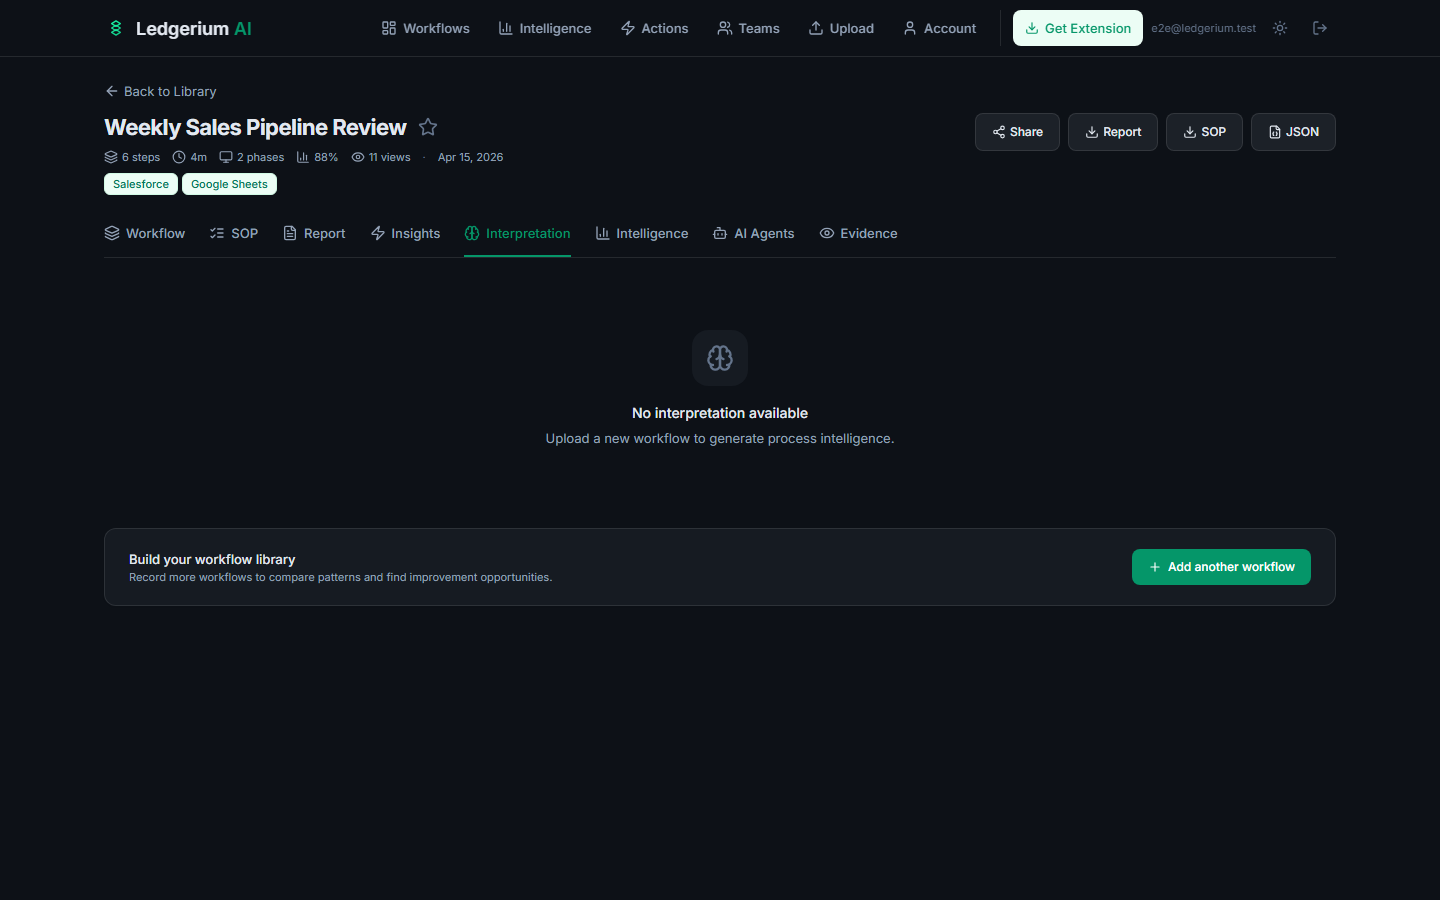
When populated, the tab includes:
- Executive summary — paragraph-level description of what the process does, who performs it, and which systems are involved.
- Process type classification — the engine’s assessment of the process category with a confidence score.
- Complexity scores — four 0–100 scores: Complexity, Friction, Linearity, and Manual Intensity.
- Phase breakdown — each detected phase with dominant action types and step count.
- Friction analysis and decision points — specific evidence-backed findings.
3.6 Intelligence Tab
The Intelligence tab shows detailed performance metrics, typically populated when multiple recordings of the same process are available for comparison.
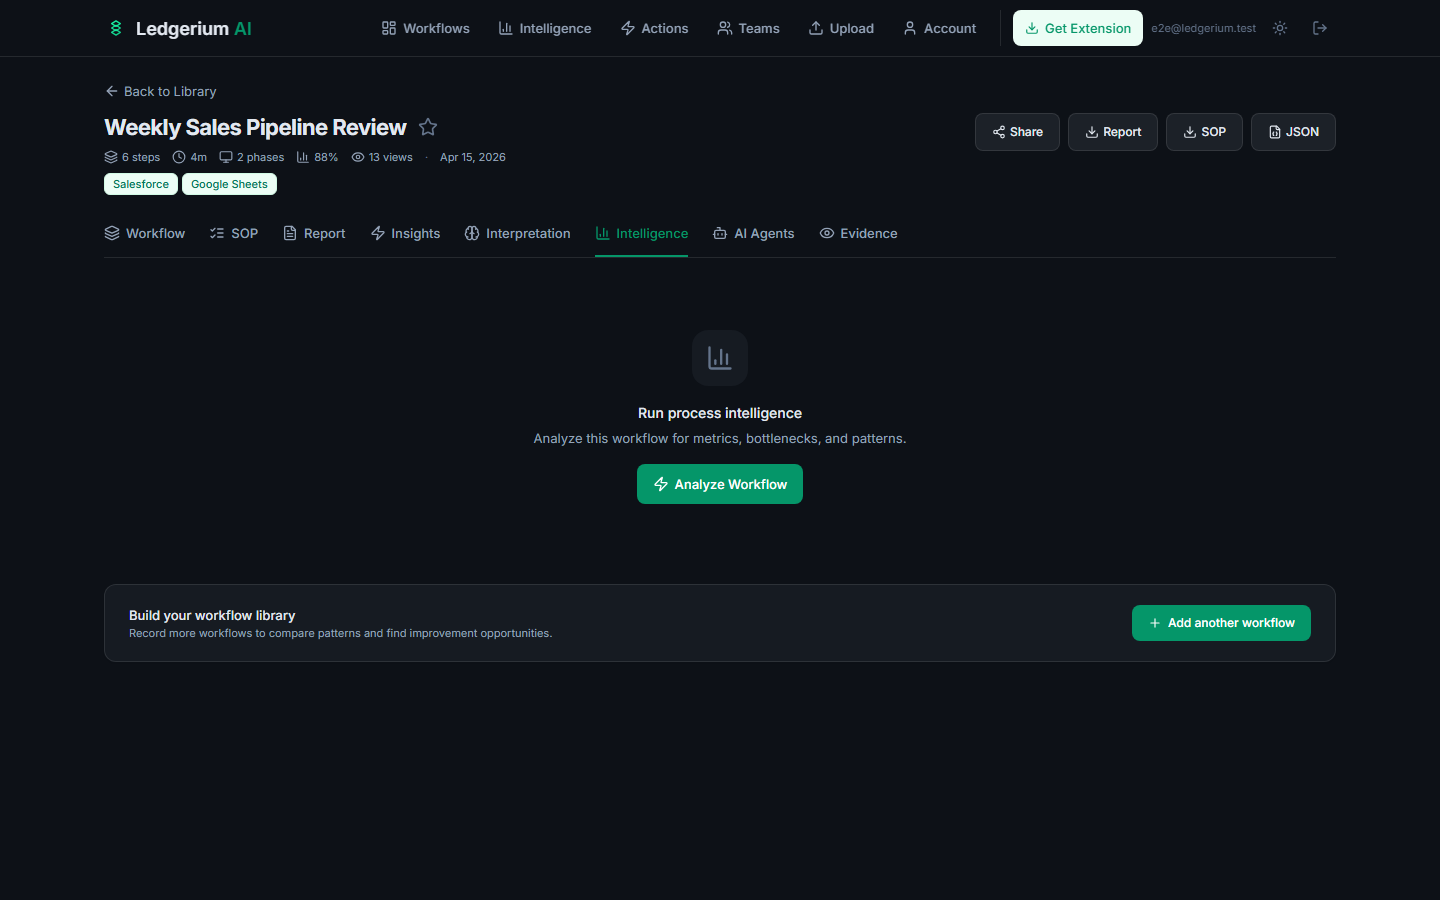
Once analysis is complete, the tab includes:
- Process metrics — run count, completion rate, duration statistics (median, mean, P90).
- Variant analysis — standard path vs. alternative execution paths with similarity scores.
- Time study — per-step duration breakdown showing steps with high variance.
- SOP alignment — how closely observed execution matches the documented SOP, including undocumented steps and drift indicators.
3.7 AI Agents Tab
The AI Agents tab analyzes the workflow from an automation perspective, identifying which steps are candidates for AI or robotic process automation.
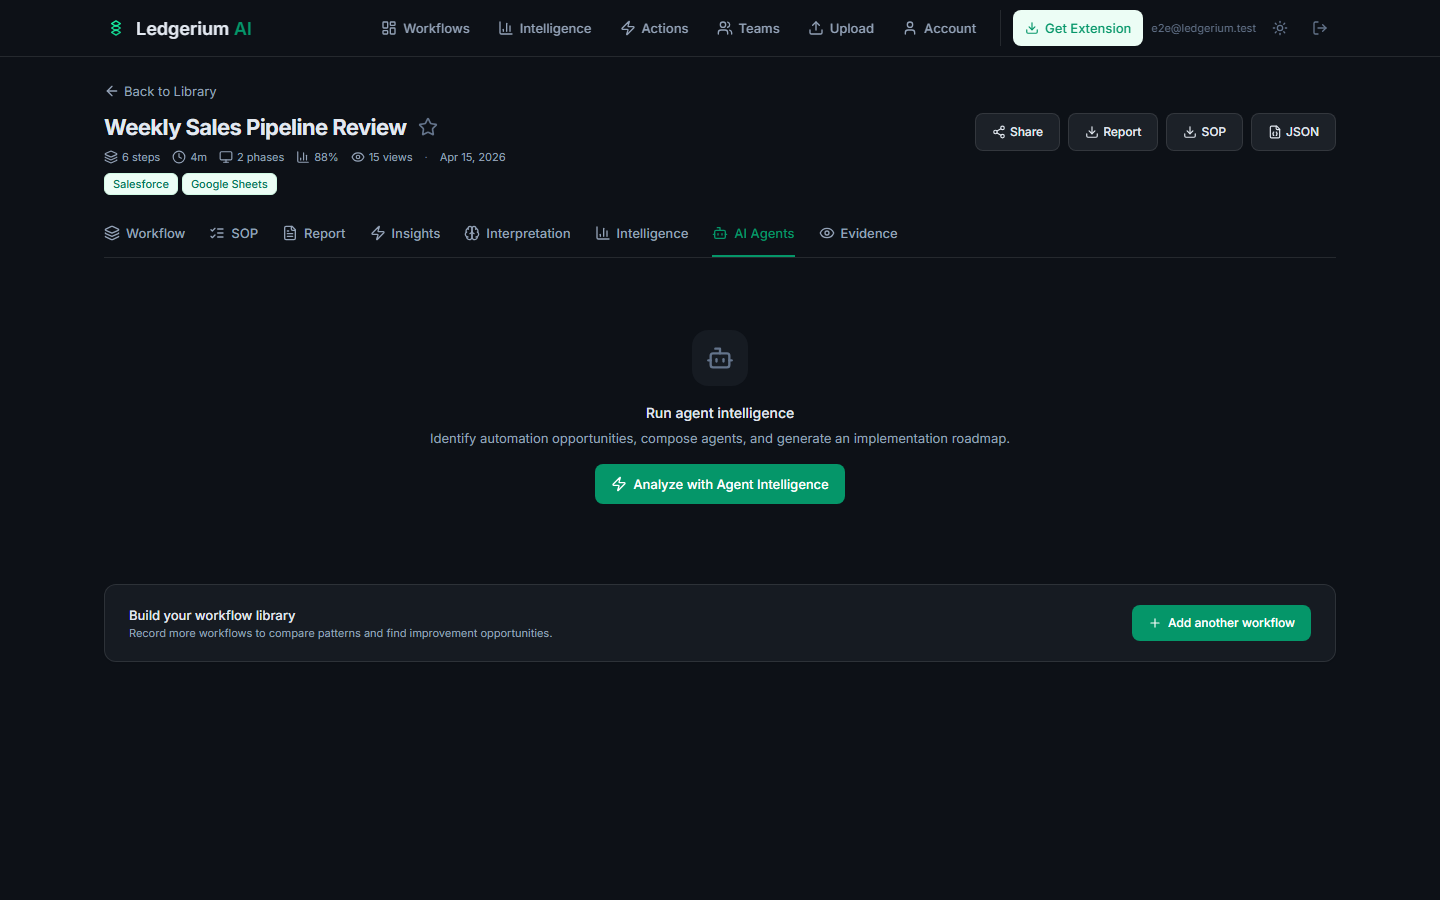
Once analysis is complete:
- Agent composition — a map of which AI agent types could cover each phase (data extraction, form-fill, decision agent, etc.).
- Automation suitability per step — each step scored 0–100 for automation potential.
- Effort and complexity estimates — development effort to automate each step.
- Success probability — estimated reliability based on execution consistency.
- Integration risk assessment — flags steps interacting with systems that may lack APIs.
3.8 Evidence Tab
The Evidence tab shows the raw structured data underlying all outputs. It is designed for engineers, auditors, and compliance reviewers who need to inspect exactly what was captured.

The tab contains expandable sections for:
- Process Run — the complete execution record with timestamps and event sequences.
- Process Definition — the canonical step definitions, boundaries, and confidence scores.
- Process Map — the structured process map with phases, nodes, and edges.
- Standard Operating Procedure — the SOP data structure.
Click Copy All JSON to copy the complete evidence bundle to your clipboard.
3.9 Process Variants & variation detection
When you record the same process more than once, Ledgerium compares the recordings to show how execution varied across runs — which steps were always taken, where paths diverged, and how often each path was followed. Variation detection is based entirely on what was observed in the recordings: it reports the frequency of each path and where paths diverge or rejoin. It does not infer the conditions that caused a run to take one path versus another.
Open it from the Workflow tab by selecting Process Variants in the map mode switcher. Variation analysis requires at least two recordings of the same process and is available on Team plans and above.
The variant map
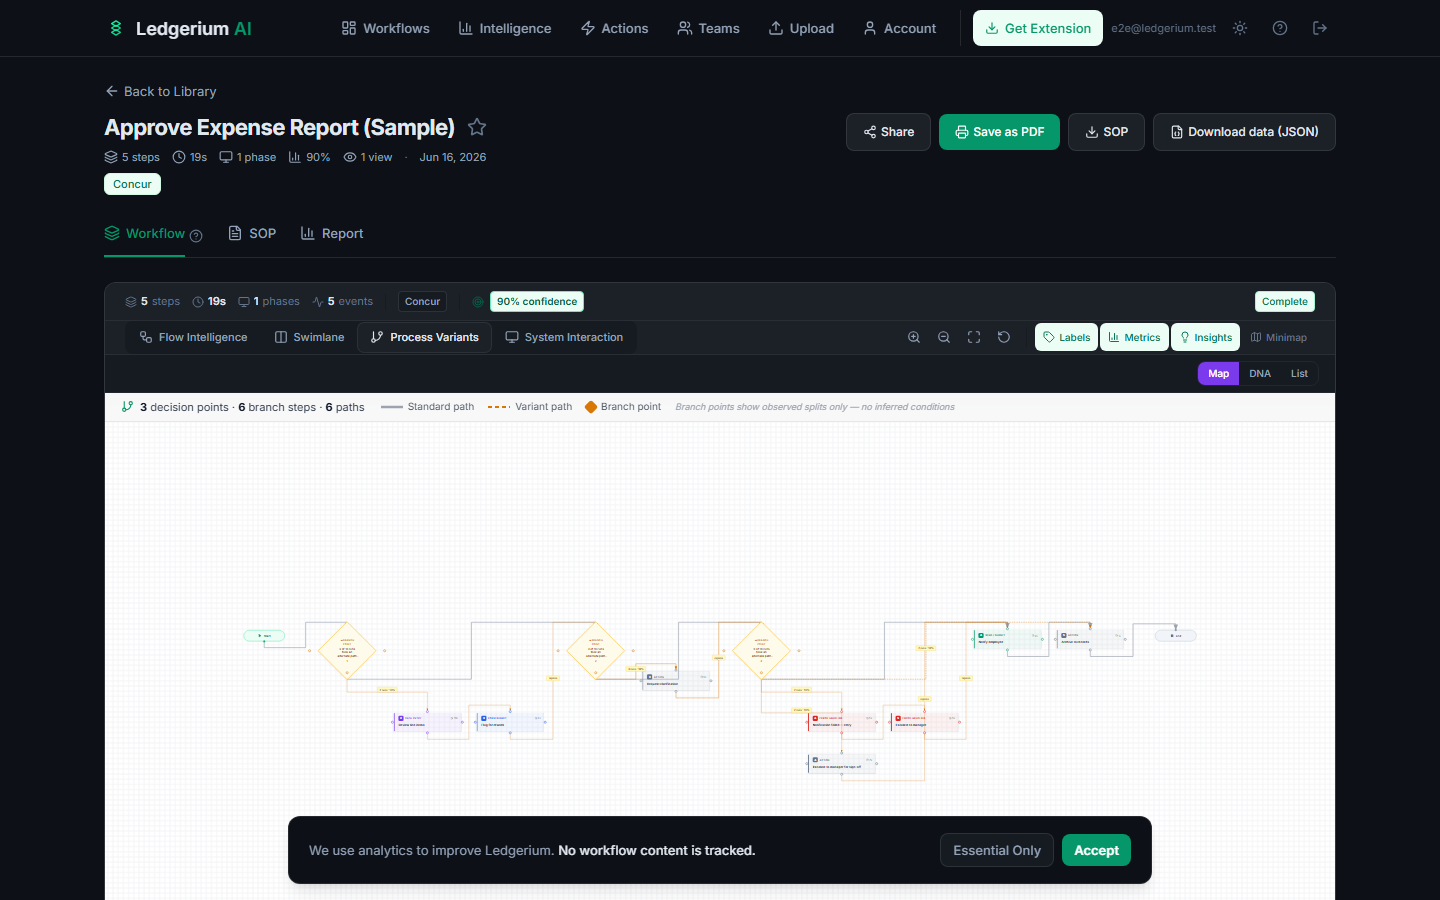
- Green spine — the standard path, followed by the largest share of runs.
- Amber branches — paths that diverge from the spine and later rejoin. Each branch is labelled with its run count and percentage (for example, “2 runs · 25%”).
- “diverges” marker — backbone steps where a branch leaves the standard path carry a small “diverges” label. This marks an observed split, not an inferred decision rule.
- Header summary — the share of runs that followed the standard path end-to-end, the total run count, and how many branches were detected.
- Complexity slider — when there are several branches, drag the slider (top-right) to show only the most-frequent ones. It is labelled “showing N/M”.
Click any branch to see the evidence — a panel lists the recordings (run IDs) that took that path. Every branch traces back to its source runs.

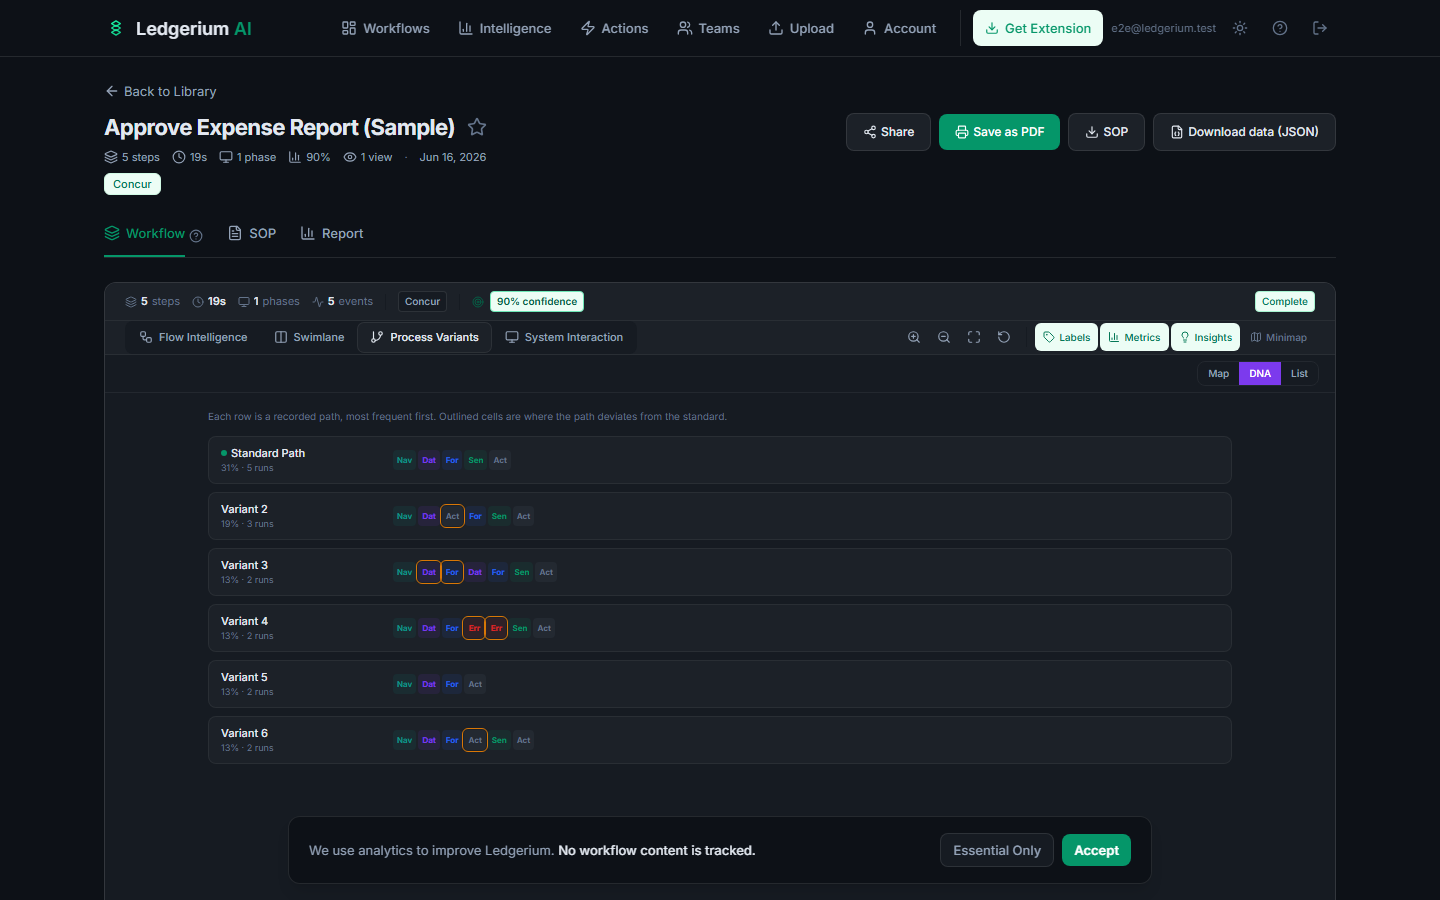
DNA view
Select DNA in the view toggle to see every recorded path as a row of colour-coded step tokens, sorted most-frequent first. Tokens outlined in amber are steps that differ from the standard path — useful for scanning many paths at a glance.
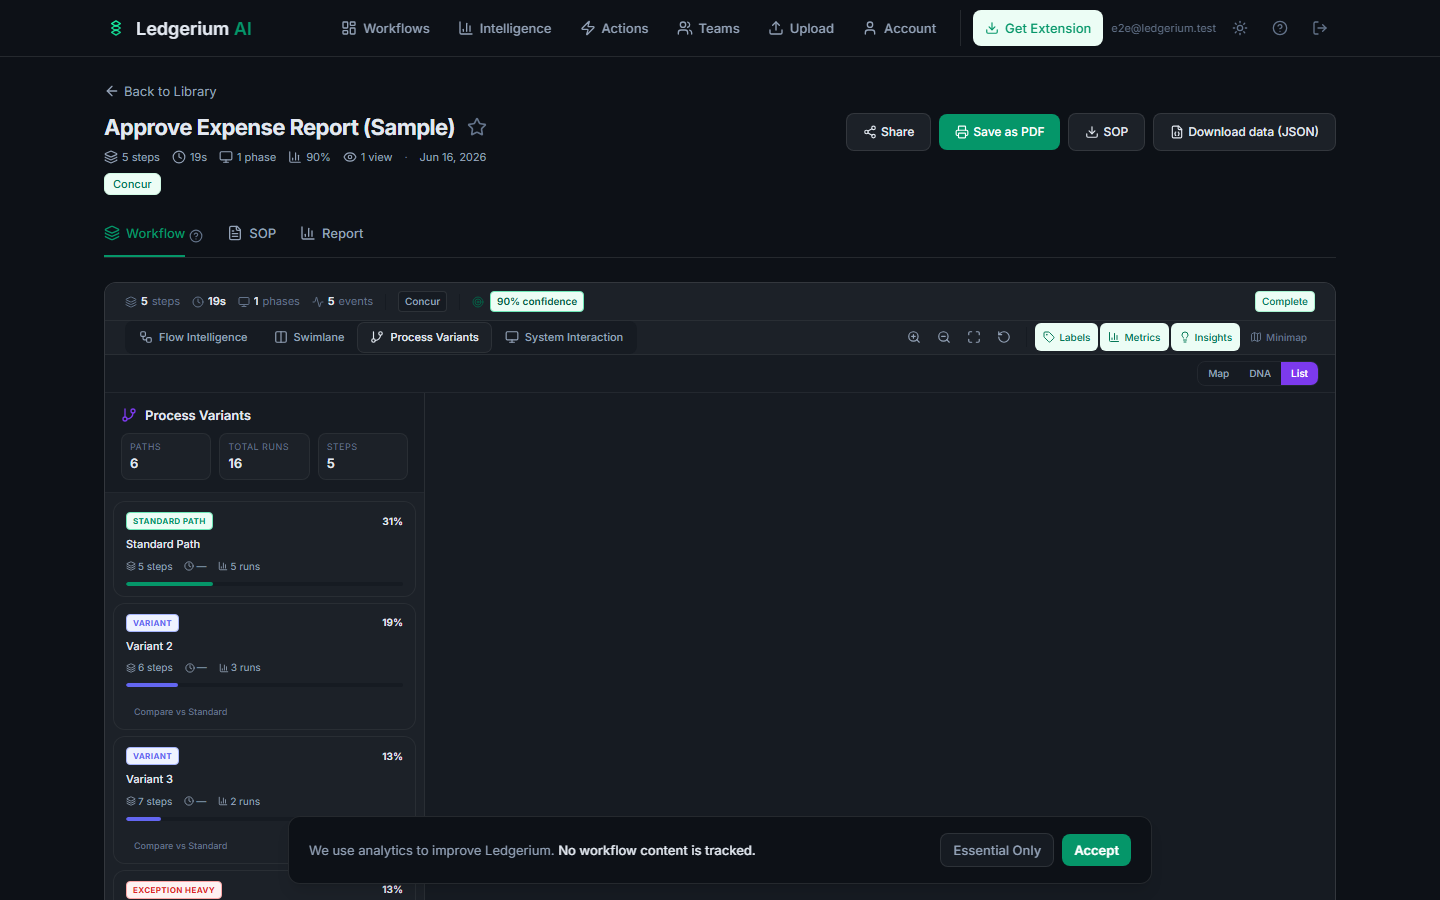
List view
Select List for a detailed breakdown. The left rail shows one card per path with a role badge — Standard Path, Fastest, Longest, Exception Heavy, or Variant — plus its frequency, step count, duration, and a frequency bar. Selecting a path shows its step sequence (steps that differ from the standard are marked DIVERGES), its summary metrics, and a Compare vs Standard option.
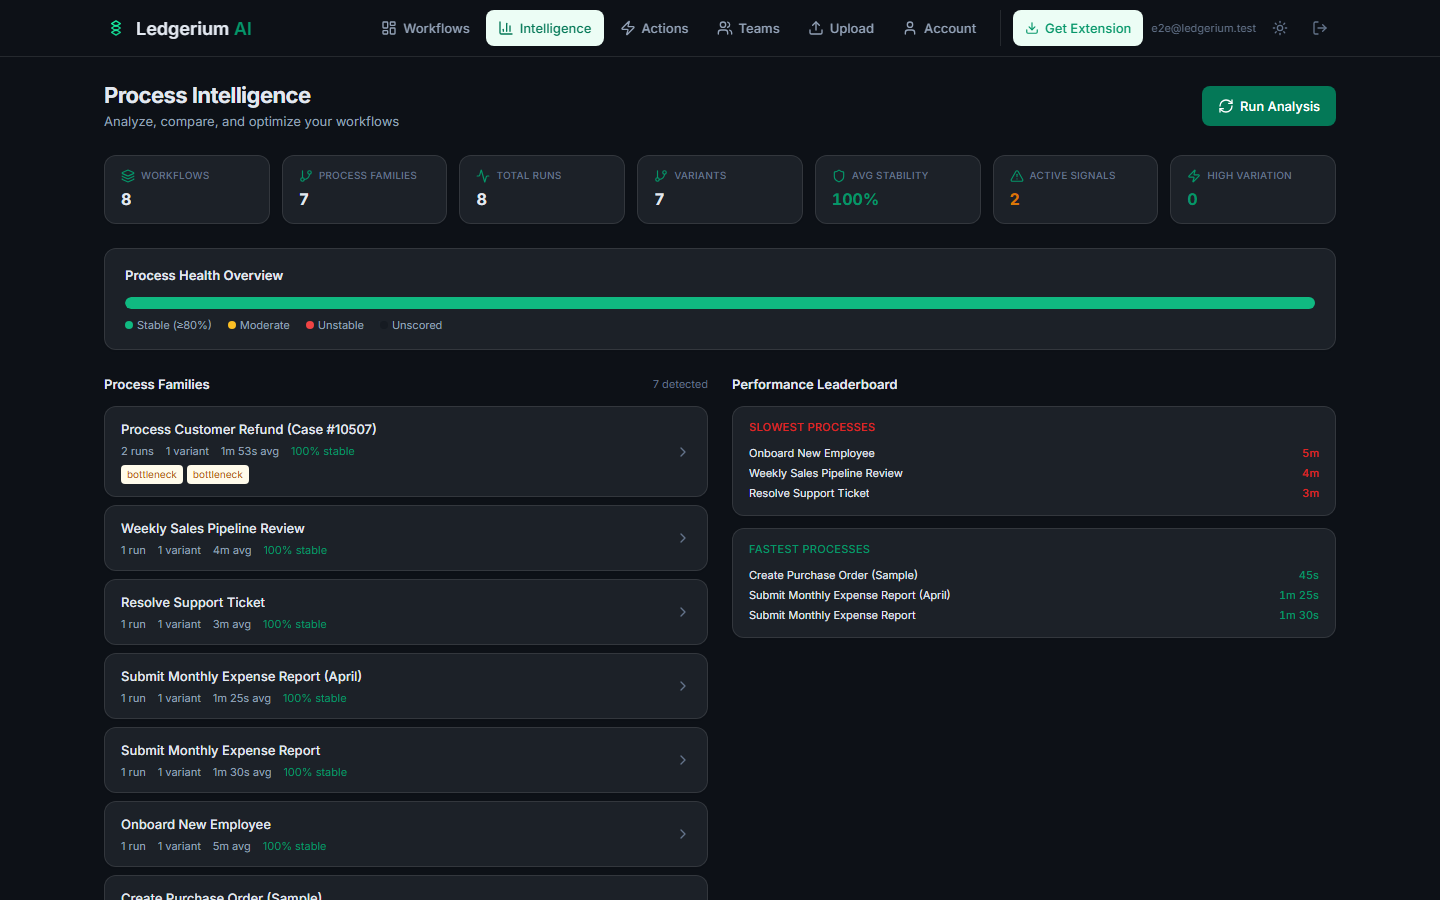
4. Process Intelligence
The Intelligence page provides portfolio-level analysis across all your workflows, surfacing patterns, comparisons, and insights across your entire library.
Access it by clicking Intelligence in the top navigation bar.
4.1 Running analysis
Click the Run Analysis button (top right) to trigger the intelligence engine. This:
- 1Clusters similar workflows into process families based on step sequence patterns.
- 2Computes aggregate metrics across all runs within each family.
- 3Detects bottlenecks, variance, and drift at the portfolio level.
- 4Generates actionable insights and standardization recommendations.
4.2 Executive summary KPIs
Summary cards across the top of the page:
| KPI | What it shows |
|---|---|
| Workflows | Count of all recordings in your library |
| Process Families | Number of distinct process types detected |
| Total Runs | Aggregate execution count across families |
| Variants | Count of alternative execution paths |
| Avg Stability | Portfolio-wide consistency score |
| Active Signals | Number of active intelligence findings |
| High Variation | Families with concerning inconsistency |
4.3 Process Health Overview
A color-coded bar showing the distribution of your workflows by health status: Stable, Moderate, Unstable, and Unanalyzed.
4.4 Process Families
Process families are clusters of similar workflows. Each family card shows the canonical name, run count, variant count, average duration, and stability score. Click any family to drill into the Process Detail view.
4.5 Performance Leaderboard
Ranked lists surfacing the workflows most in need of attention: Slowest processes, Highest variation, and Fastest processes.
4.6 Process Detail view
Click any process family from the Intelligence page to open the detailed view.
The detail view includes:
- Time study analysis — per-step duration breakdown with mean, median, and P90.
- Variance analysis — duration CV, step count CV, and sequence stability.
- Process variants — visualization of all execution paths with frequency.
- SOP alignment — alignment score, undocumented steps, drift indicators.
- Standardization scorecard — readiness for standardization.
- Automation ROI candidates — steps ranked by automation potential and impact.
- AI recommendations — specific recommendations with type, impact, confidence, effort, and evidence.
5. Recommendations Center
The Recommendations page aggregates all AI-generated recommendations across your entire workflow library into one actionable view.
Access it by clicking Actions in the navigation bar.
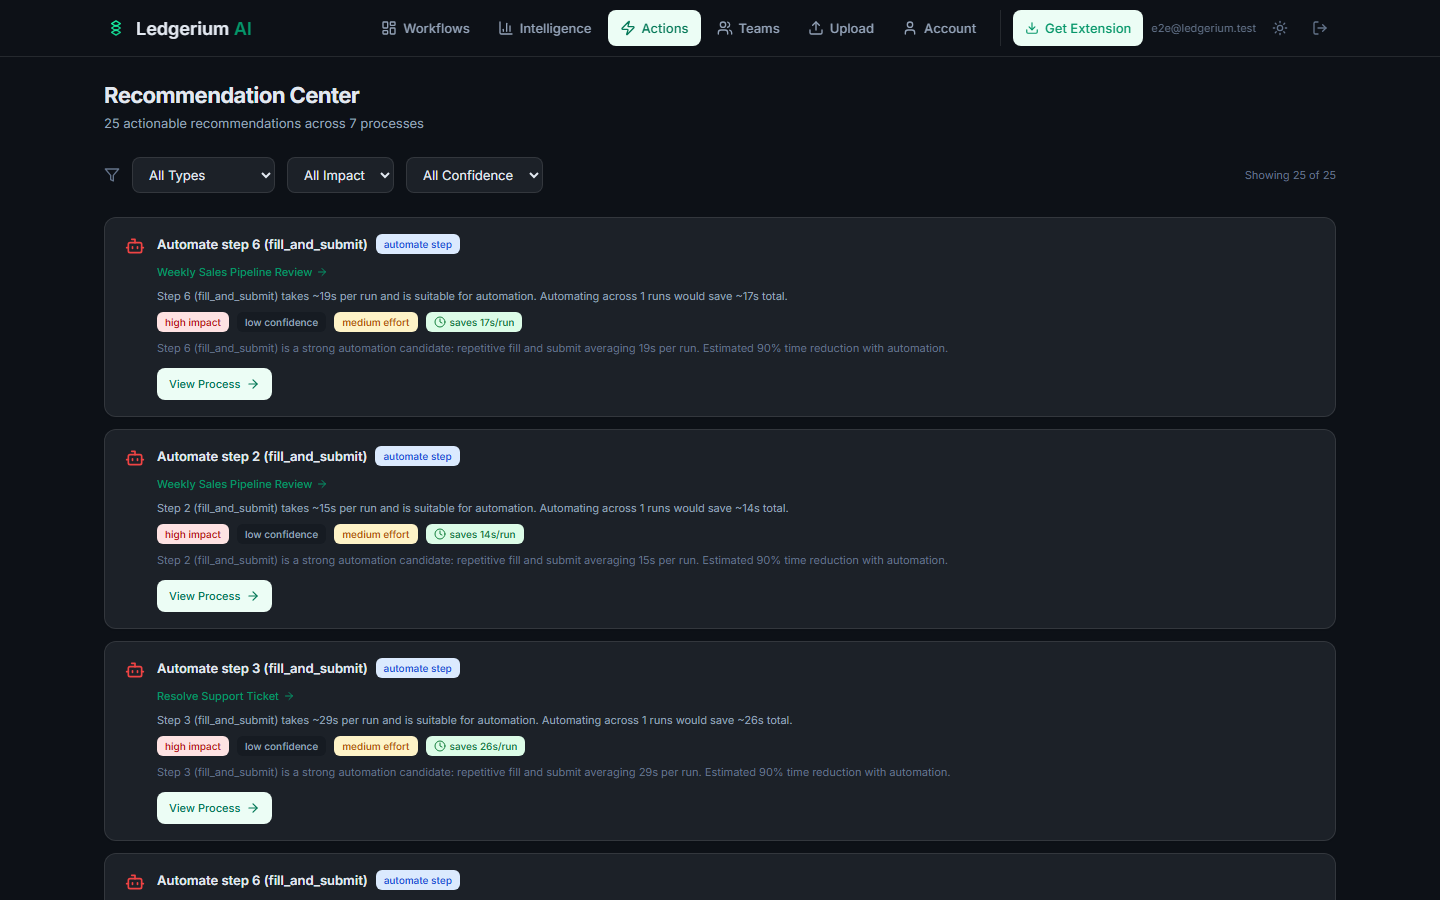
Filtering recommendations
Use the filter toolbar to narrow the list:
- By type — All Types, Standardize, Update SOP, Automate, Reduce Rework, Optimize Handoff.
- By impact — All Impact, High, Medium, Low.
- By confidence — All Confidence, High, Medium, Low.
Recommendation cards
Each card shows:
- Type badge — the category (e.g., “Automate step 4”).
- Process name — which process family the recommendation applies to.
- Description — what to do and why, with specific evidence.
- Impact, Confidence, Effort badges — color-coded severity indicators.
- View Process link — jump directly to the Process Detail page.
6. Teams & Collaboration
Teams allow multiple users to share a workflow library, record together, and collaborate on process documentation.
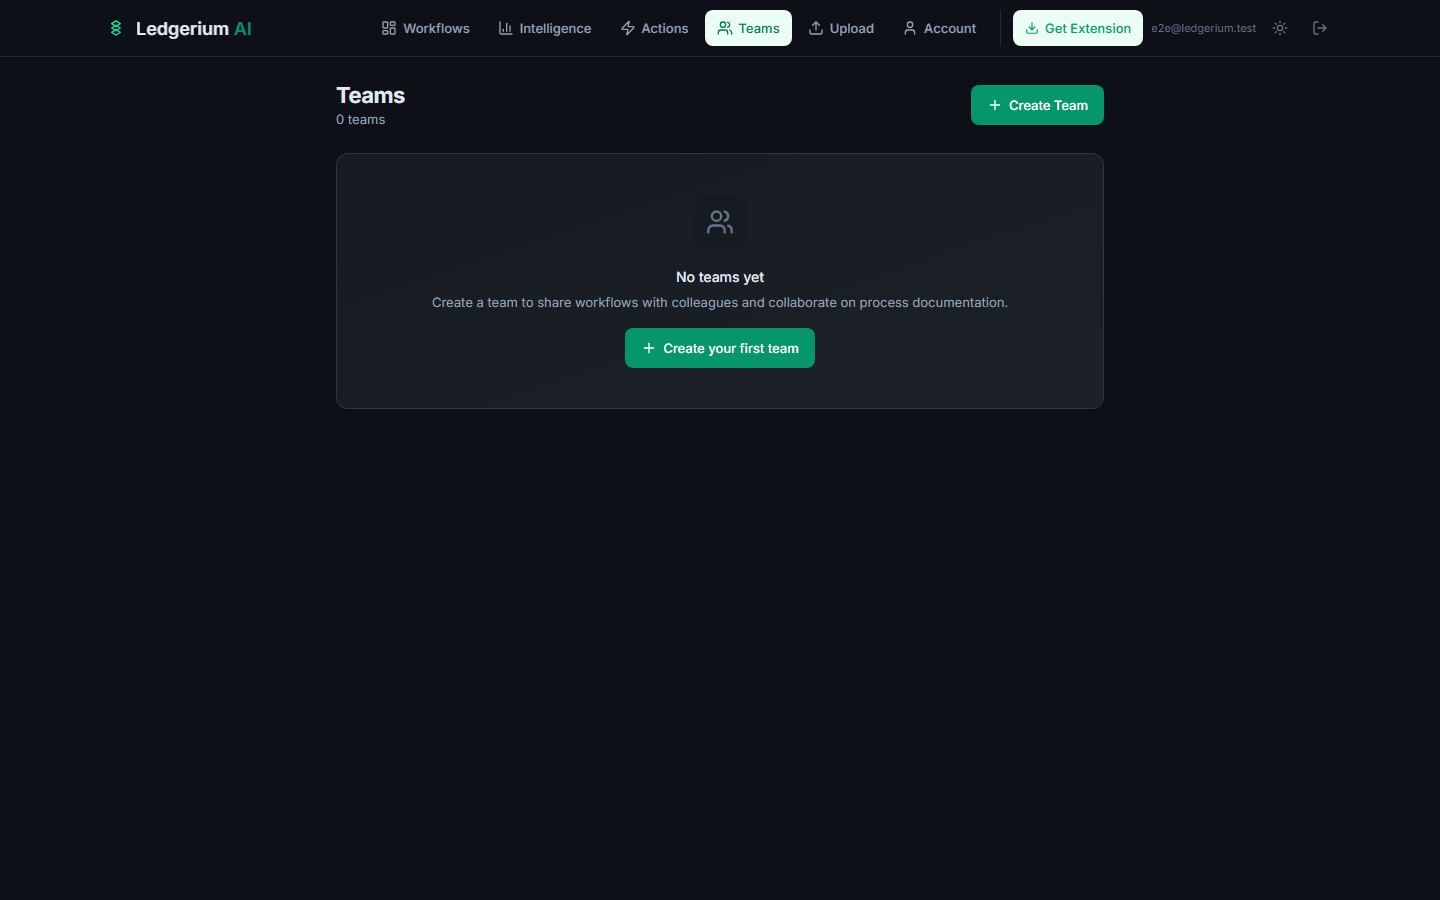
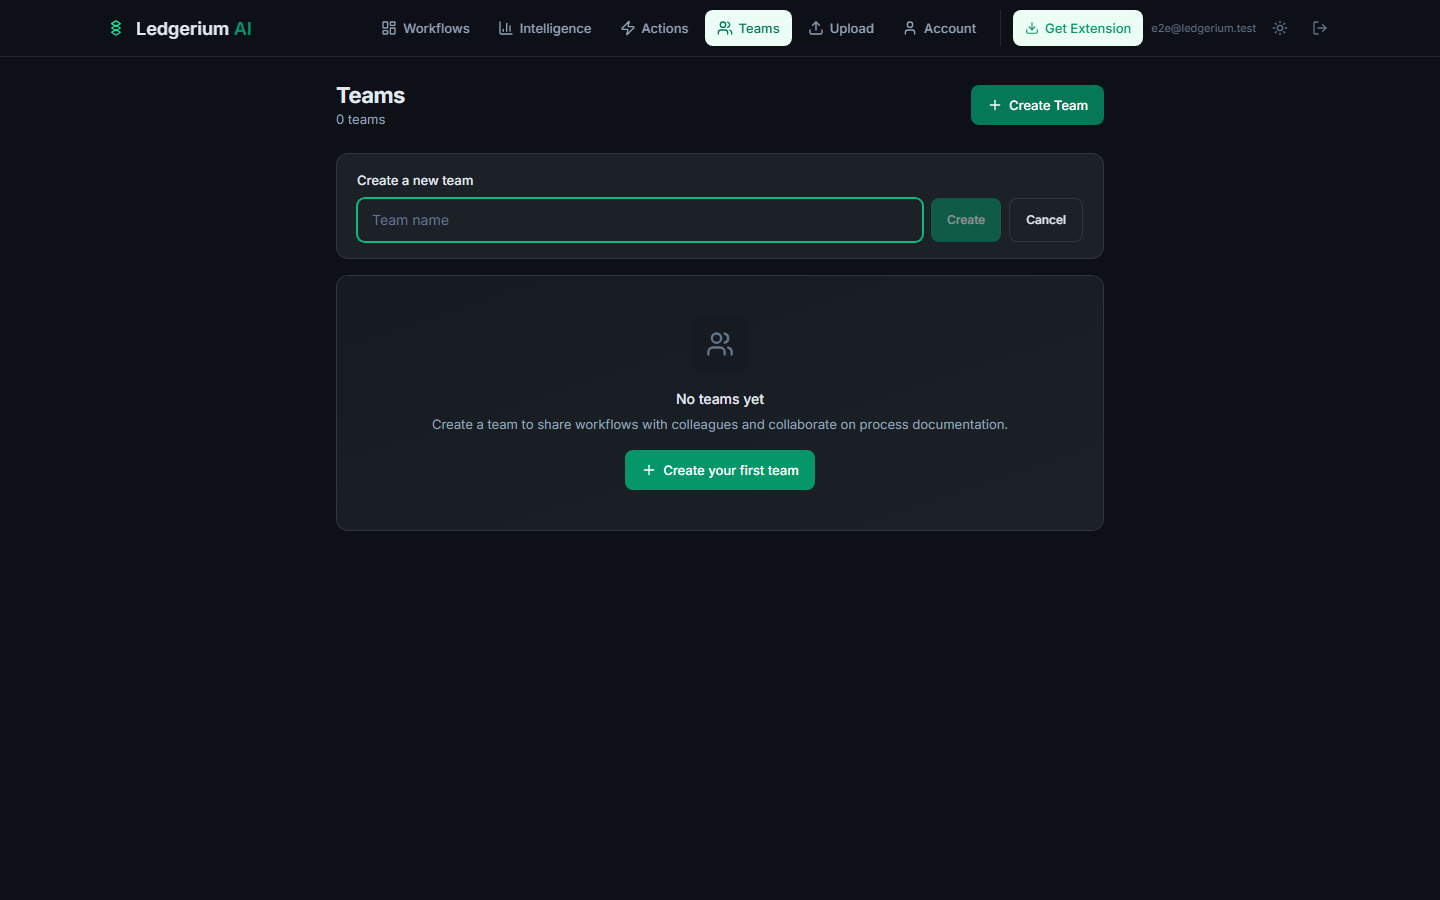
6.1 Creating a team
- 1Click Teams in the navigation bar.
- 2Click + Create Team.
- 3Enter a team name.
- 4Click Create.
6.2 Inviting team members
- 1Go to your team’s page.
- 2Click Invite Member.
- 3Enter the email address of the person you want to invite.
- 4Select their role.
- 5Click Send Invite.
The invitee receives a link. They can follow it to join — even if they don’t yet have a Ledgerium account.
6.3 Member roles
| Role | Permissions |
|---|---|
| Owner | Full control: manage billing, delete the team, assign any role |
| Admin | Manage members, invite others, manage all workflows and portfolios |
| Member | Record workflows, upload, view and edit shared library, create portfolios |
| Viewer | Read-only access to the shared library, no recording permissions |
6.4 Shared workflow library
Once on a team, all Member and Admin recordings are visible in the shared team library. Portfolio organization applies across the whole team. Any team member with the appropriate role can view, search, filter, export workflows, assign them to portfolios, and run intelligence analysis across the full team library.
7. Account & Settings
Manage your profile, billing, API keys, and privacy settings.
Access your account by clicking Account in the top navigation bar.

7.1 Profile
- Email — your login email (read-only).
- Name — your display name (editable).
- Member since — account creation date.
7.2 Plan & Billing
- Current Plan — your active plan name.
- Status — subscription status (active, trialing, etc.).
- Uploads — recording count for the current billing period.
- Click Upgrade Now (for free/starter users) to change plans.
- For paid users, the Manage Subscription link opens Stripe’s billing portal.
7.3 Extension Sync
This is where you create and manage API keys for connecting the Chrome extension to your account. You can create up to 3 API keys.
- The key prefix is shown for identification (the full key is only revealed at creation time).
- The last-used date is displayed for each key.
- Click the trash icon to revoke a key.
7.4 Trust & Privacy
The account page includes a summary of Ledgerium AI’s commitments:
- All workflow processing is deterministic — same input, same output.
- Sensitive values are never stored — only field labels are preserved.
- Your workflow data is private to your account.
8. Sharing Workflows
Share any workflow with someone outside your account using a public link — no login required for the viewer.
8.1 Enabling sharing
- 1Open the workflow you want to share.
- 2Click the Share button in the workflow header.
- 3Toggle sharing on in the dialog.
- 4A public URL is generated. Click Copy Link to copy it to your clipboard.
8.2 What shared viewers see
Visitors with the public link can view:
- The workflow metadata (title, step count, duration, confidence, tools).
- The SOP tab — full standard operating procedure.
- The Report tab — health scorecard and key metrics.
Shared viewers cannot: edit the workflow, access the Evidence tab, download raw JSON, or access your other workflows.
8.3 Revoking shared access
- 1Open the workflow.
- 2Click Share.
- 3Toggle sharing off.
The previous link immediately stops working. If you re-enable sharing, a new unique link is generated.
9. Exporting Data
Ledgerium AI outputs are designed to be portable. Export in multiple formats from the workflow detail page header.
Export formats
| Button | What downloads | Available on |
|---|---|---|
| JSON | Complete structured output: process run, definition, map, and SOP in one machine-readable file | All plans |
| Report | Workflow report as a structured document | Starter+ |
| SOP | Standard operating procedure as a standalone document | Starter+ |
Files are named after the workflow title (e.g., weekly-sales-pipeline-review-sop.json).
Exporting raw workflow data
Click the JSON button for the most complete export. Use it for:
- Archiving recordings for compliance.
- Importing into custom tools or pipelines.
- Sharing with engineering teams building automations.
Watermarked vs. clean exports
| Plan | Export quality |
|---|---|
| Free | Watermarked — includes a Ledgerium AI attribution footer |
| Starter and above | Clean exports — no watermark |
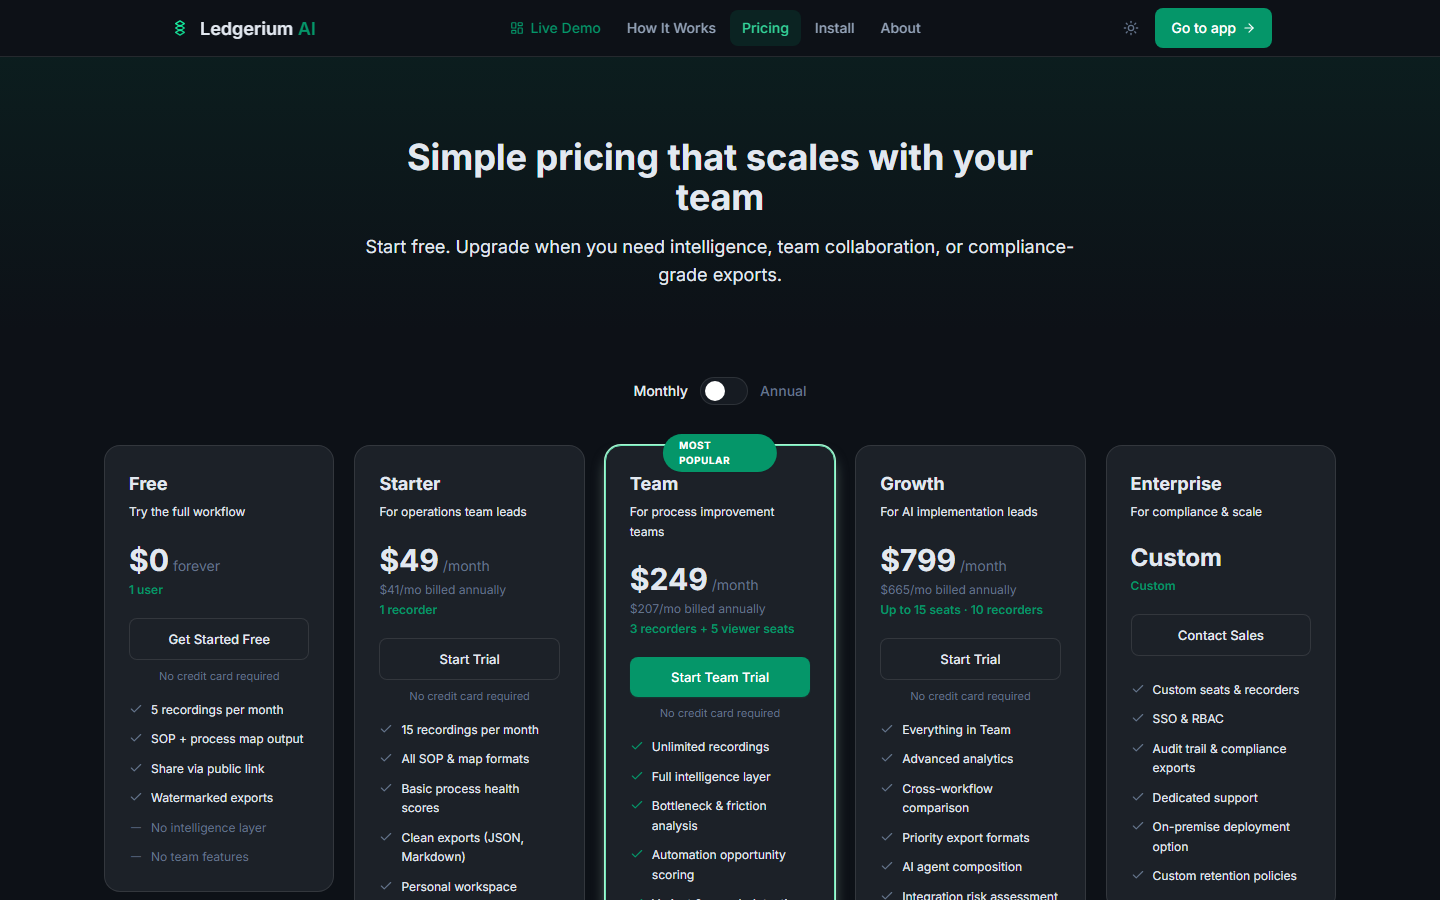
10. Plans & Pricing
Ledgerium AI offers five plan tiers. Annual billing saves approximately 17% compared to monthly.
Plan comparison
| Feature | Free | Starter | Team | Growth | Enterprise |
|---|---|---|---|---|---|
| Price (monthly) | $0 | $49 | $249 | $799 | Custom |
| Price (annual) | — | $41/mo | $207/mo | $665/mo | Custom |
| Seats | 1 user | 1 recorder | 3 recorders + 5 viewers | 10 recorders, 15 seats | Custom |
| Recordings/month | 5 | 15 | Unlimited | Unlimited | Custom |
| SOP + process map | Yes | Yes | Yes | Yes | Yes |
| Public sharing | Yes | Yes | Yes | Yes | Yes |
| Clean exports | No | Yes | Yes | Yes | Yes |
| Health scores | No | Yes | Yes | Yes | Yes |
| Full intelligence layer | No | No | Yes | Yes | Yes |
| Bottleneck & friction analysis | No | No | Yes | Yes | Yes |
| Automation scoring | No | No | Yes | Yes | Yes |
| Shared team library | No | No | Yes | Yes | Yes |
| Advanced analytics | No | No | No | Yes | Yes |
| AI agent composition | No | No | No | Yes | Yes |
| SSO & RBAC | No | No | No | No | Yes |
| Audit trail | No | No | No | No | Yes |
| On-premise option | No | No | No | No | Yes |
Plan details
Free — For individuals exploring the platform. Record up to 5 workflows per month, generate SOPs and process maps, share via public link. Exports include a watermark.
Starter ($49/mo) — For operations leads documenting their own processes. 15 recordings/month, clean exports, basic health scores.
Team ($249/mo) — For process improvement teams. Unlimited recordings, full intelligence layer, bottleneck analysis, automation scoring, shared team workspace.
Growth ($799/mo) — For AI implementation leads. Everything in Team, plus advanced analytics, cross-workflow comparison, AI agent composition, BPMN export.
Enterprise (custom) — For compliance-sensitive or large-scale deployments. SSO, RBAC, audit trail, on-premise option, custom retention. Contact hello@ledgerium.ai.
Upgrading your plan
- 1Go to Account in the navigation bar.
- 2Click Upgrade Now in the Plan & Billing section.
- 3Select your desired plan.
- 4Complete payment via Stripe’s secure checkout.
- 5Your account is upgraded immediately.
11. Privacy & Security
Ledgerium AI is designed as a trust-first platform. This section explains exactly what the extension captures, what it does not capture, and what controls you have.
11.1 What the extension captures
When recording is active, the extension captures:
- Click events — where you clicked, element type (button, link, field), and when.
- Navigation events — page transitions, URL changes at the domain/path level.
- Form field interactions — which field was interacted with and its type, but not the content typed.
- Timing data — how long each step and overall session took.
- Application context — which tools and domains were active at each point.
11.2 What the extension does NOT capture
Ledgerium AI never intentionally captures:
- Screenshots or screen video
- Keystrokes or typed content
- Passwords, credentials, or one-time codes
- Clipboard contents
- Microphone audio or camera video
- Background activity when recording is stopped
- Hidden form field values that expose credentials
11.3 Automatic sensitive value redaction
Input elements known to be sensitive — password fields, payment fields, and fields with standard autocomplete attributes indicating credential or financial data — are automatically excluded at the point of recording. Even if you record a workflow involving a login step, the password is never sent to Ledgerium AI.
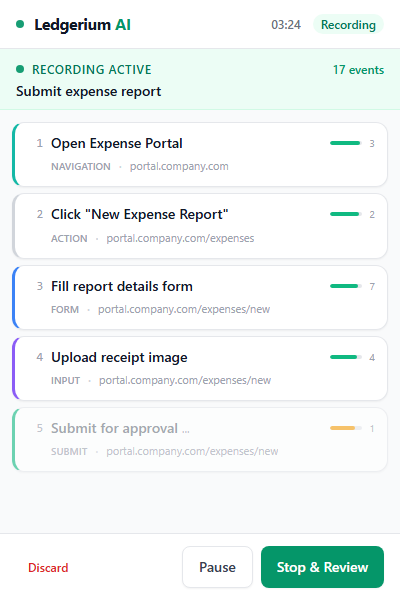
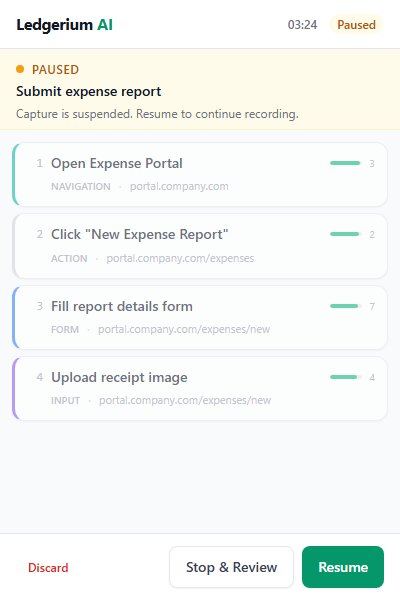
11.4 Recording state visibility
The extension always shows you when recording is active. There is no background or hidden recording state. You can:
- See the live recording indicator in the side panel.
- Pause recording at any time with a single click.
- Stop recording at any time.
- Review captured steps before uploading.
- Discard a recording entirely.
11.5 Data storage
- Data is encrypted in transit (HTTPS/TLS).
- Access is controlled by your account credentials.
- Team workflows are only visible to members with the appropriate role.
- Ledgerium AI staff do not access your data except to resolve a support issue you have explicitly raised.
11.6 User control summary
| Control | How to use it |
|---|---|
| Start recording | Click Record in the extension side panel |
| Pause recording | Click Pause in the side panel |
| Stop recording | Click Stop in the side panel |
| Discard a recording | Use the discard option before uploading |
| Delete a workflow | Hover over the card and click the trash icon |
| Revoke extension access | Delete the API key in Account > Extension Sync |
12. Troubleshooting & FAQ
Common questions and solutions for the most frequently encountered issues.
Extension not visible after install
Problem: The extension installed but you cannot see the icon in the Chrome toolbar.
Solution:
- 1Click the puzzle-piece icon in the Chrome toolbar (top right).
- 2Find Ledgerium AI in the extension list.
- 3Click the pin icon to pin it to the toolbar.
How to enable Developer Mode
Problem: Chrome is asking you to enable Developer Mode before you can load the extension.
Solution:
- 1Navigate to
chrome://extensions. - 2Toggle Developer mode on (top-right switch).
- 3Return to the Load unpacked step.
Extension not syncing
Problem: You stop a recording but the workflow does not appear in your dashboard.
Checklist:
- 1Open the extension side panel and click Sync Settings.
- 2Confirm the Sync URL is set to
https://ledgerium.ai/api/sync. - 3Confirm the API key is pasted correctly with no extra spaces.
- 4Verify the key hasn’t been revoked in Account > Extension Sync.
- 5Check your internet connection.
- 6Try uploading the recording manually via the Upload page as a fallback.
Dashboard is empty
Problem: You can log in but your dashboard shows no workflows.
Solutions:
- If you haven’t recorded yet, click Try a sample workflow to load a pre-built example.
- If you have recorded but not synced, go to Upload and manually upload the
.jsonfile. - Check whether a portfolio filter is active that might be hiding workflows.
Recording not capturing events
Problem: You are recording but the extension is not showing events.
Checklist:
- 1Confirm the recording indicator shows Recording Active.
- 2Some pages restrict extensions. Chrome system pages (
chrome://,chrome-extension://) won’t capture events. Navigate to a normal web application. - 3Try stopping and starting a new recording.
- 4If the problem persists on a specific application, contact support.
What does “confidence score” mean?
The confidence score reflects how certain the process engine is about the step boundaries it detected. A high score (green) means the engine cleanly identified where one step ended and another began. A lower score (amber or red) means there was ambiguity — for example, very rapid navigation or overlapping actions.
A lower score does not mean the recording is wrong. It means you may want to review the step breakdown in the Evidence tab.
Can I record workflows across multiple tabs?
Yes. The extension captures events across all active tabs during a recording session. Multi-tab workflows are common when a process moves between a CRM, email, and spreadsheet. The Swimlane view will show each application in its own lane.
Is Ledgerium AI GDPR or HIPAA compliant?
The platform is designed with data minimization principles and does not capture sensitive personal content. Compliance readiness depends on your deployment context and governance policies. If you operate in a regulated environment, contact hello@ledgerium.ai before deploying.
Forgot password
Contact support at hello@ledgerium.ai to reset your password.
How do I contact support?
Email hello@ledgerium.ai with your account email and a description of what you were trying to do.
Still have questions? hello@ledgerium.ai
Get started free