From recording to process intelligence in minutes
Capture real browser workflows. Get structured SOPs, interactive process maps, health scores, and AI-powered analysis — deterministically.
No credit card required. Explore sample workflows instantly.
Live demo — no signup
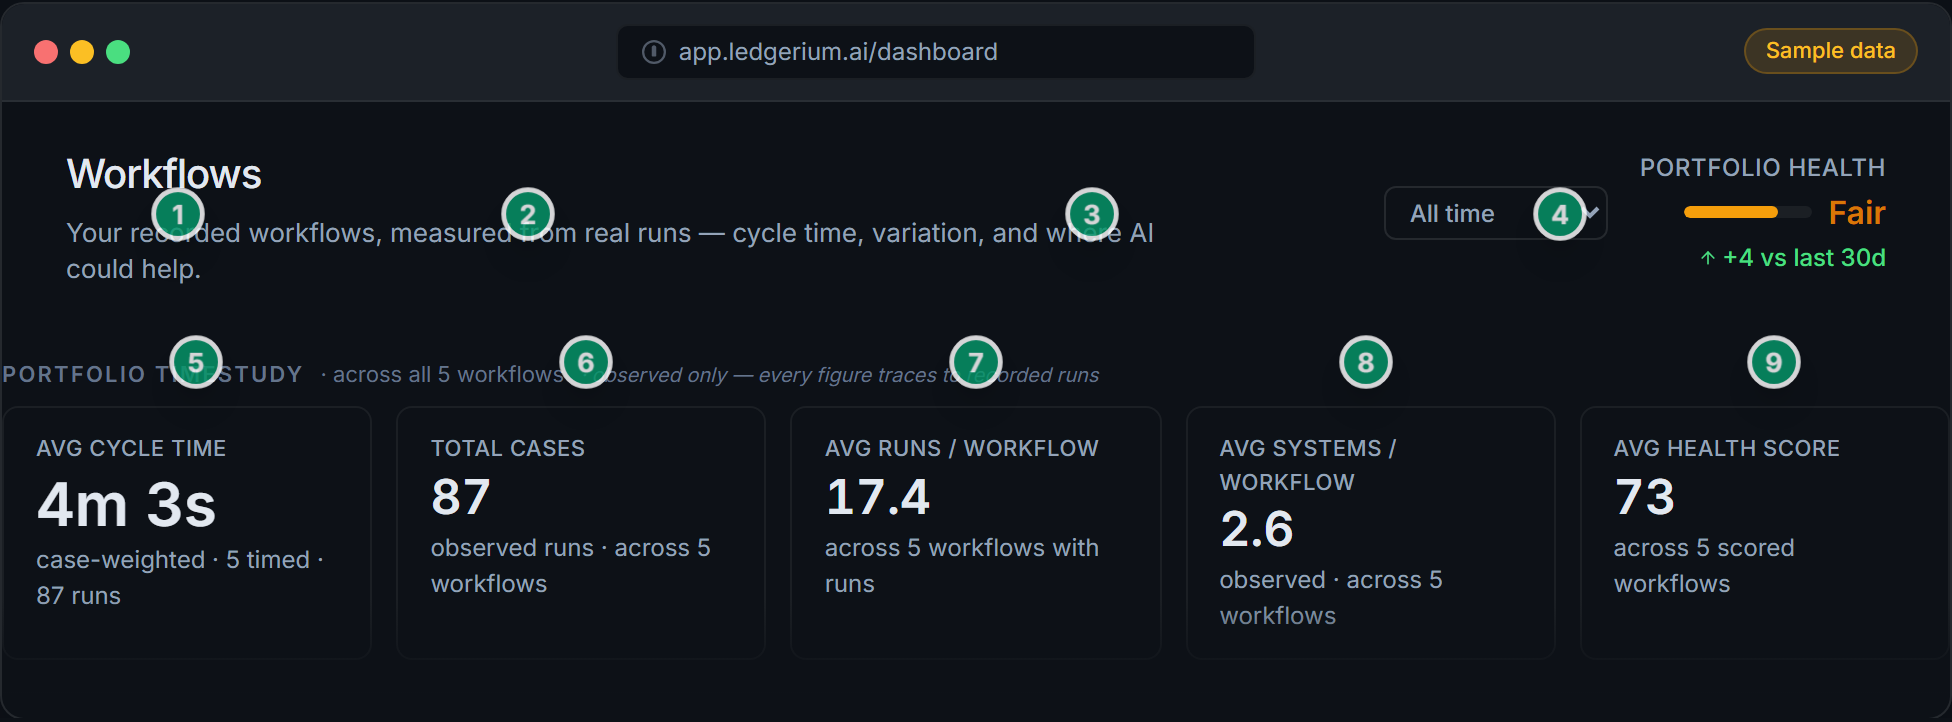
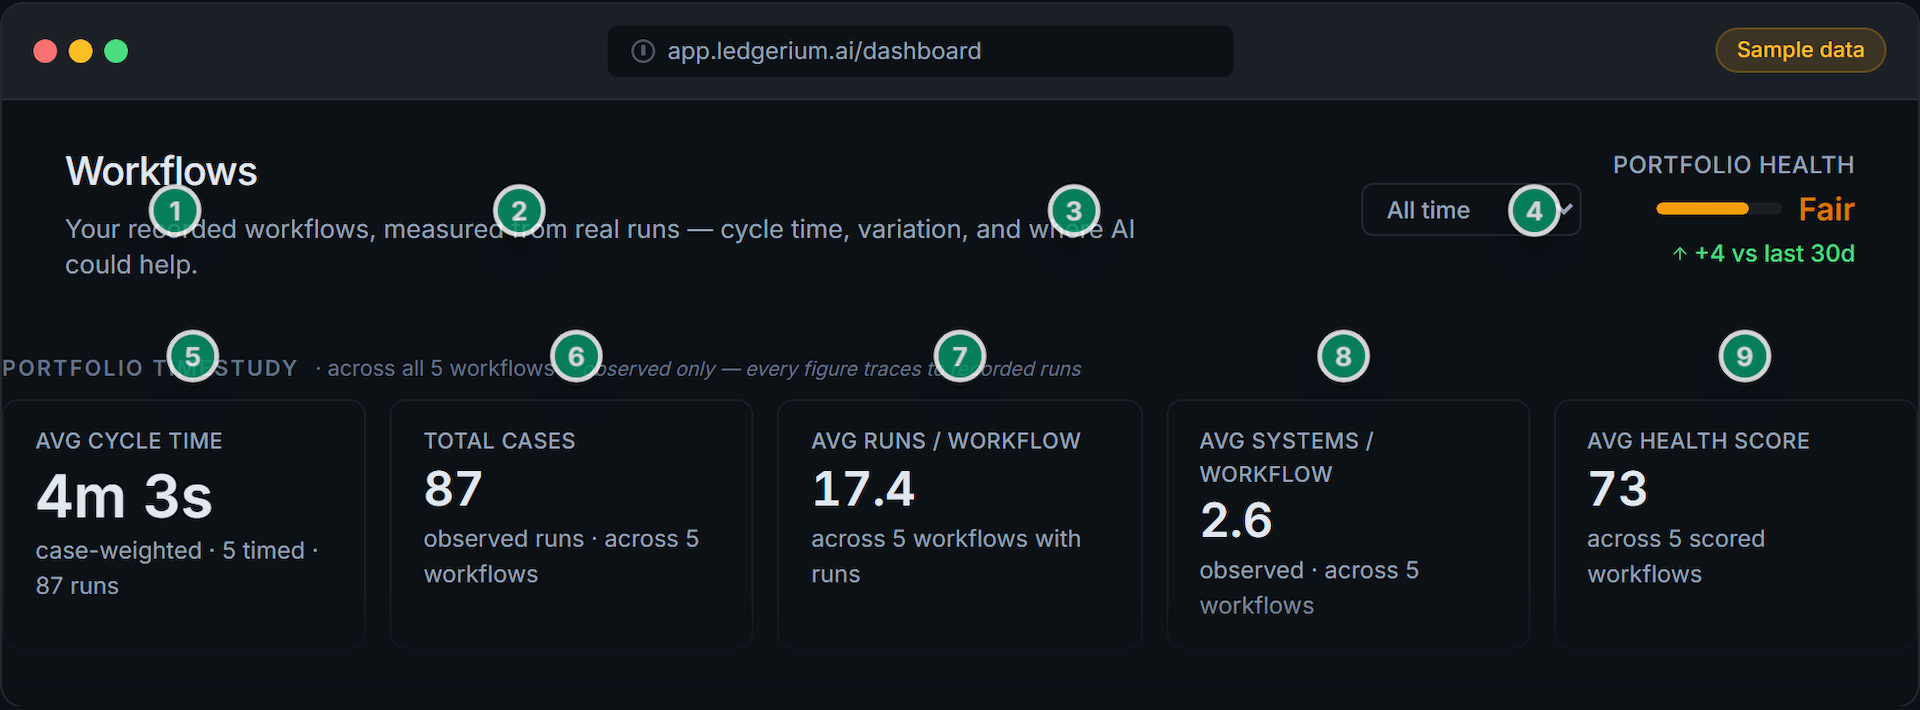
The workflow library dashboard
The dashboard aggregates every recorded workflow into a portfolio baseline. Click any numbered marker to learn what each surface measures.
Click any numbered marker to learn what each surface measures.
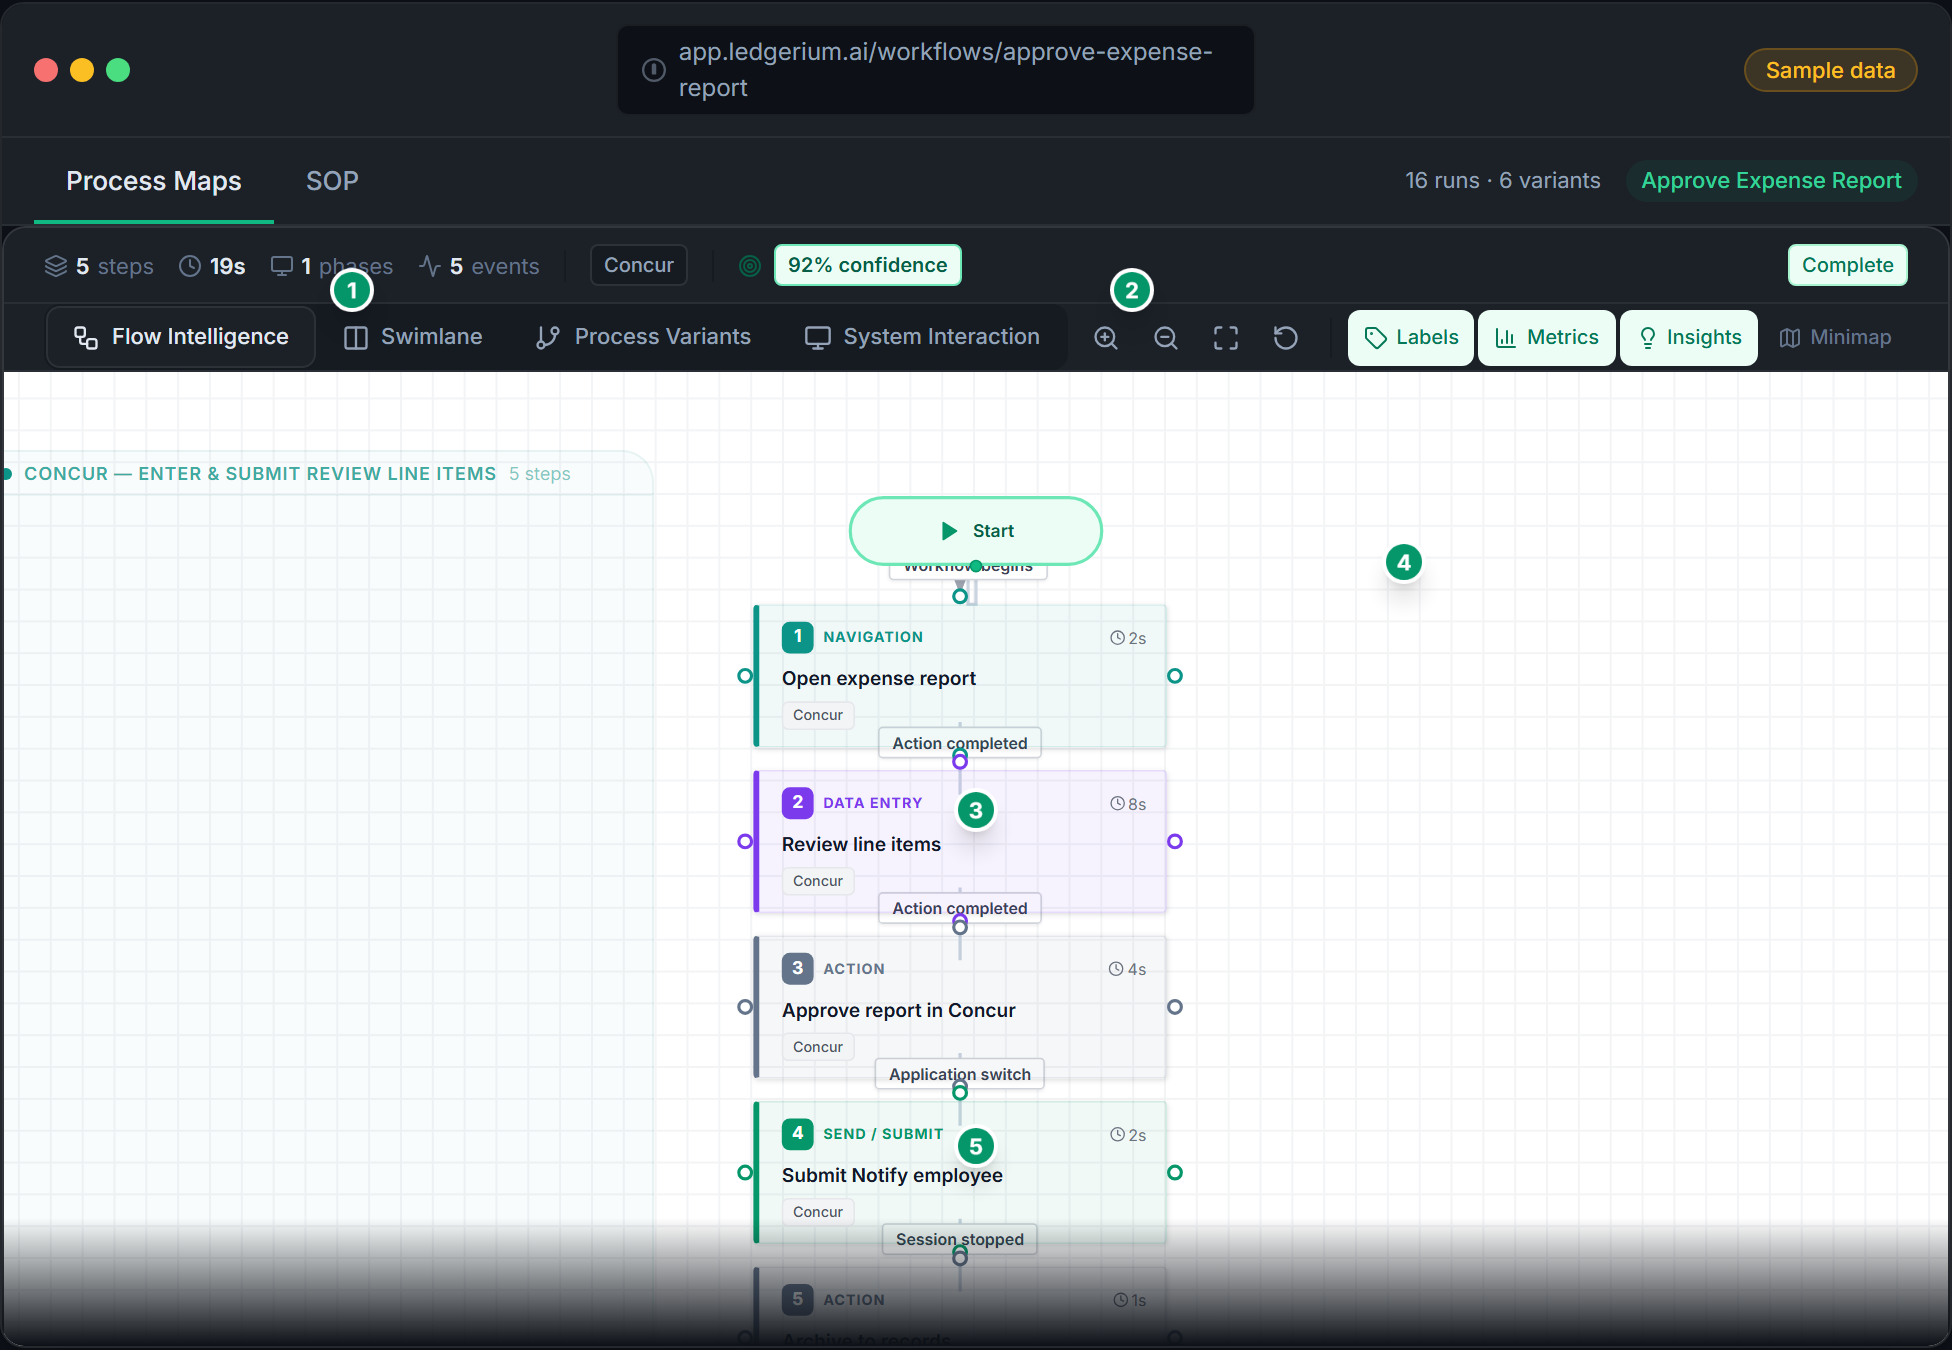
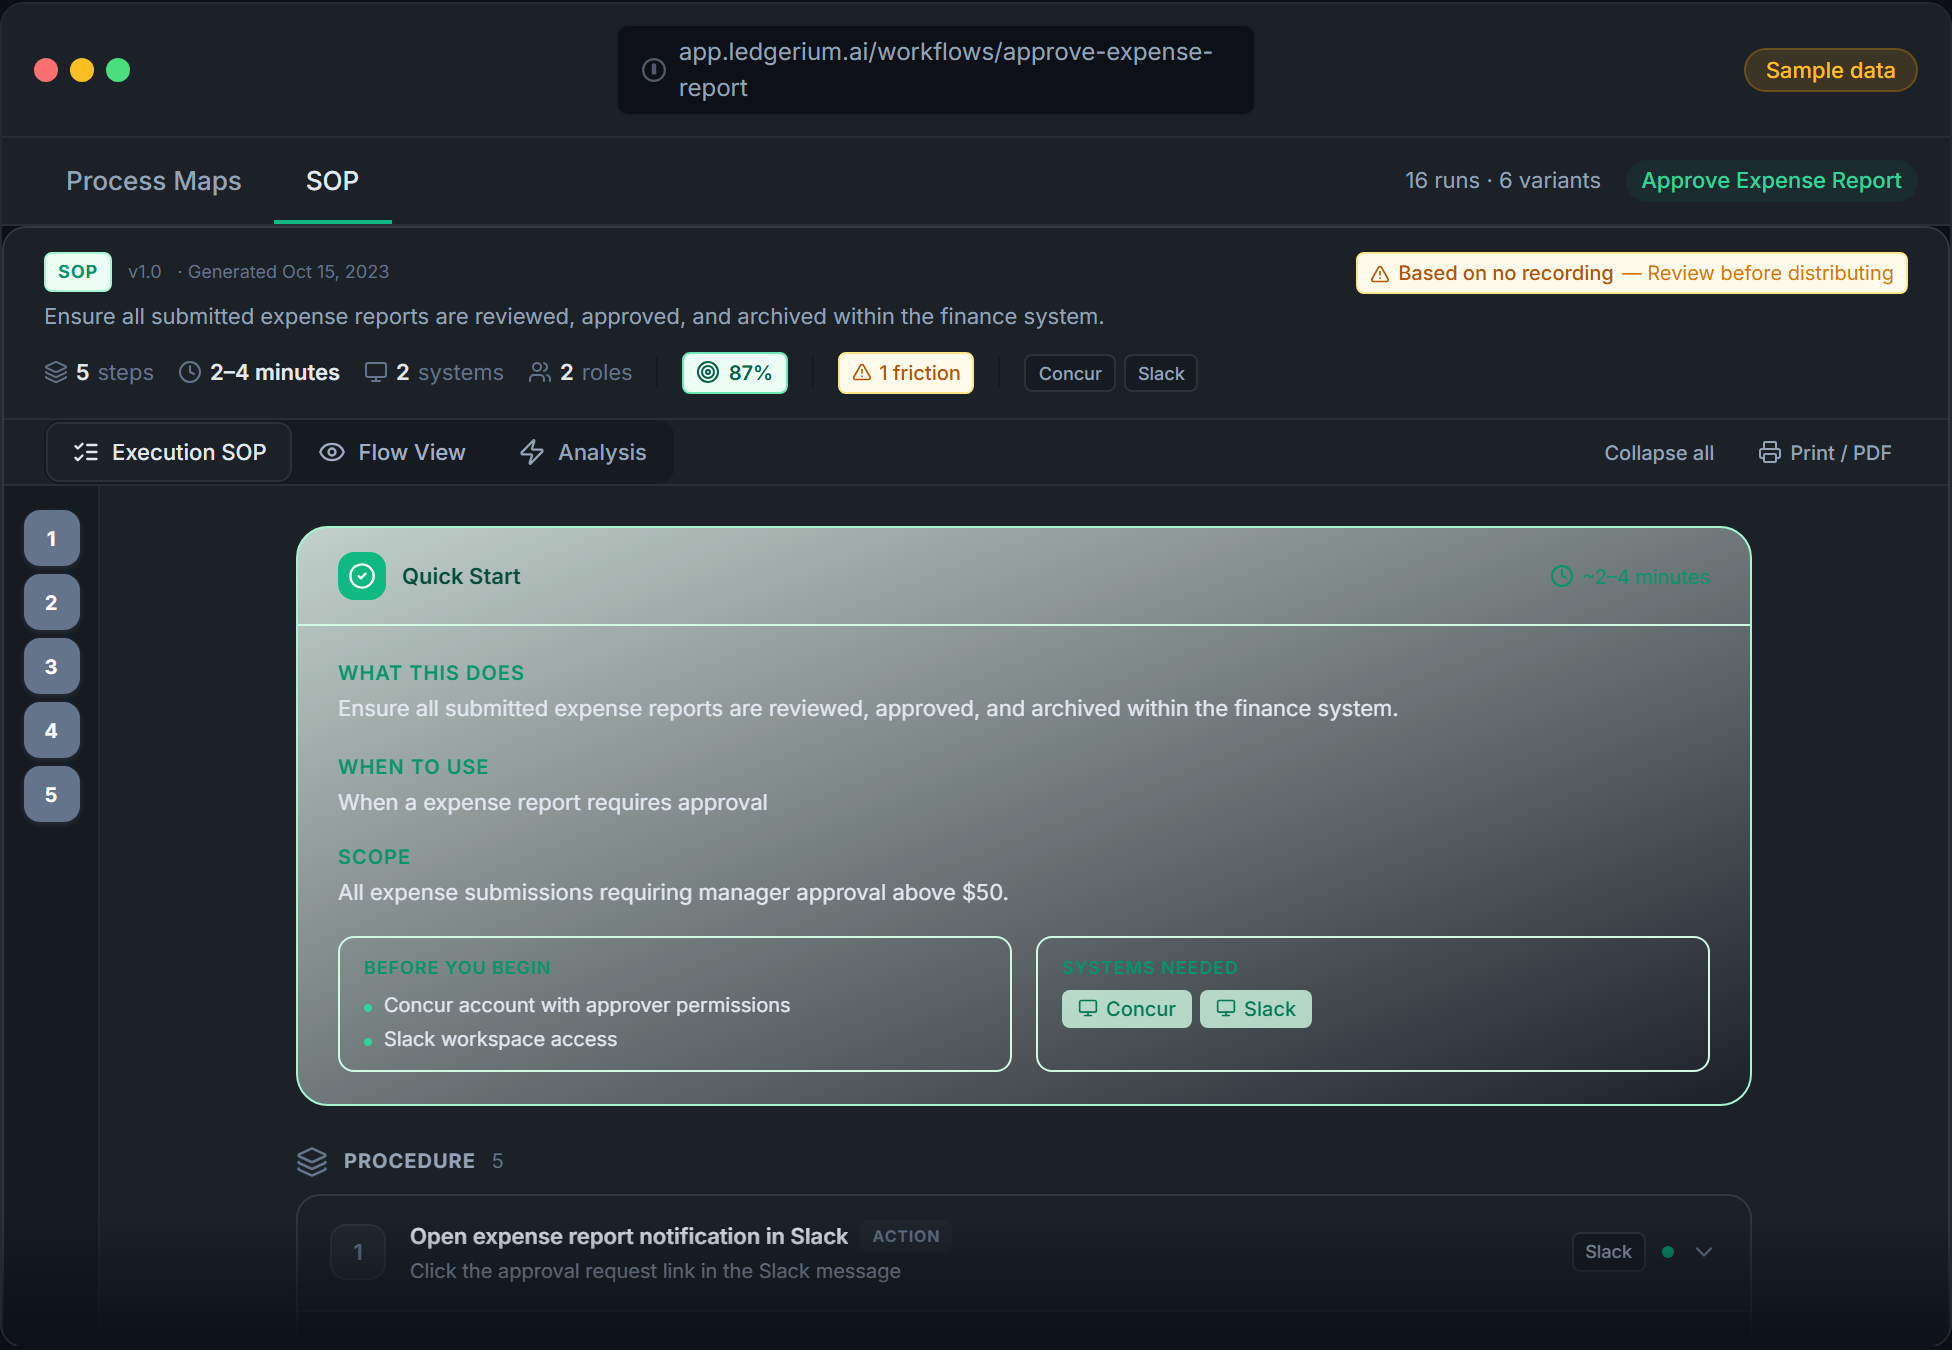
Drill into any workflow
Process map, SOP, and variants — in one place
Click any numbered marker to learn what each view surfaces. Switch between the process map and the generated SOP.
Click any numbered marker to learn what each surface measures. Switch tabs to see the SOP view.
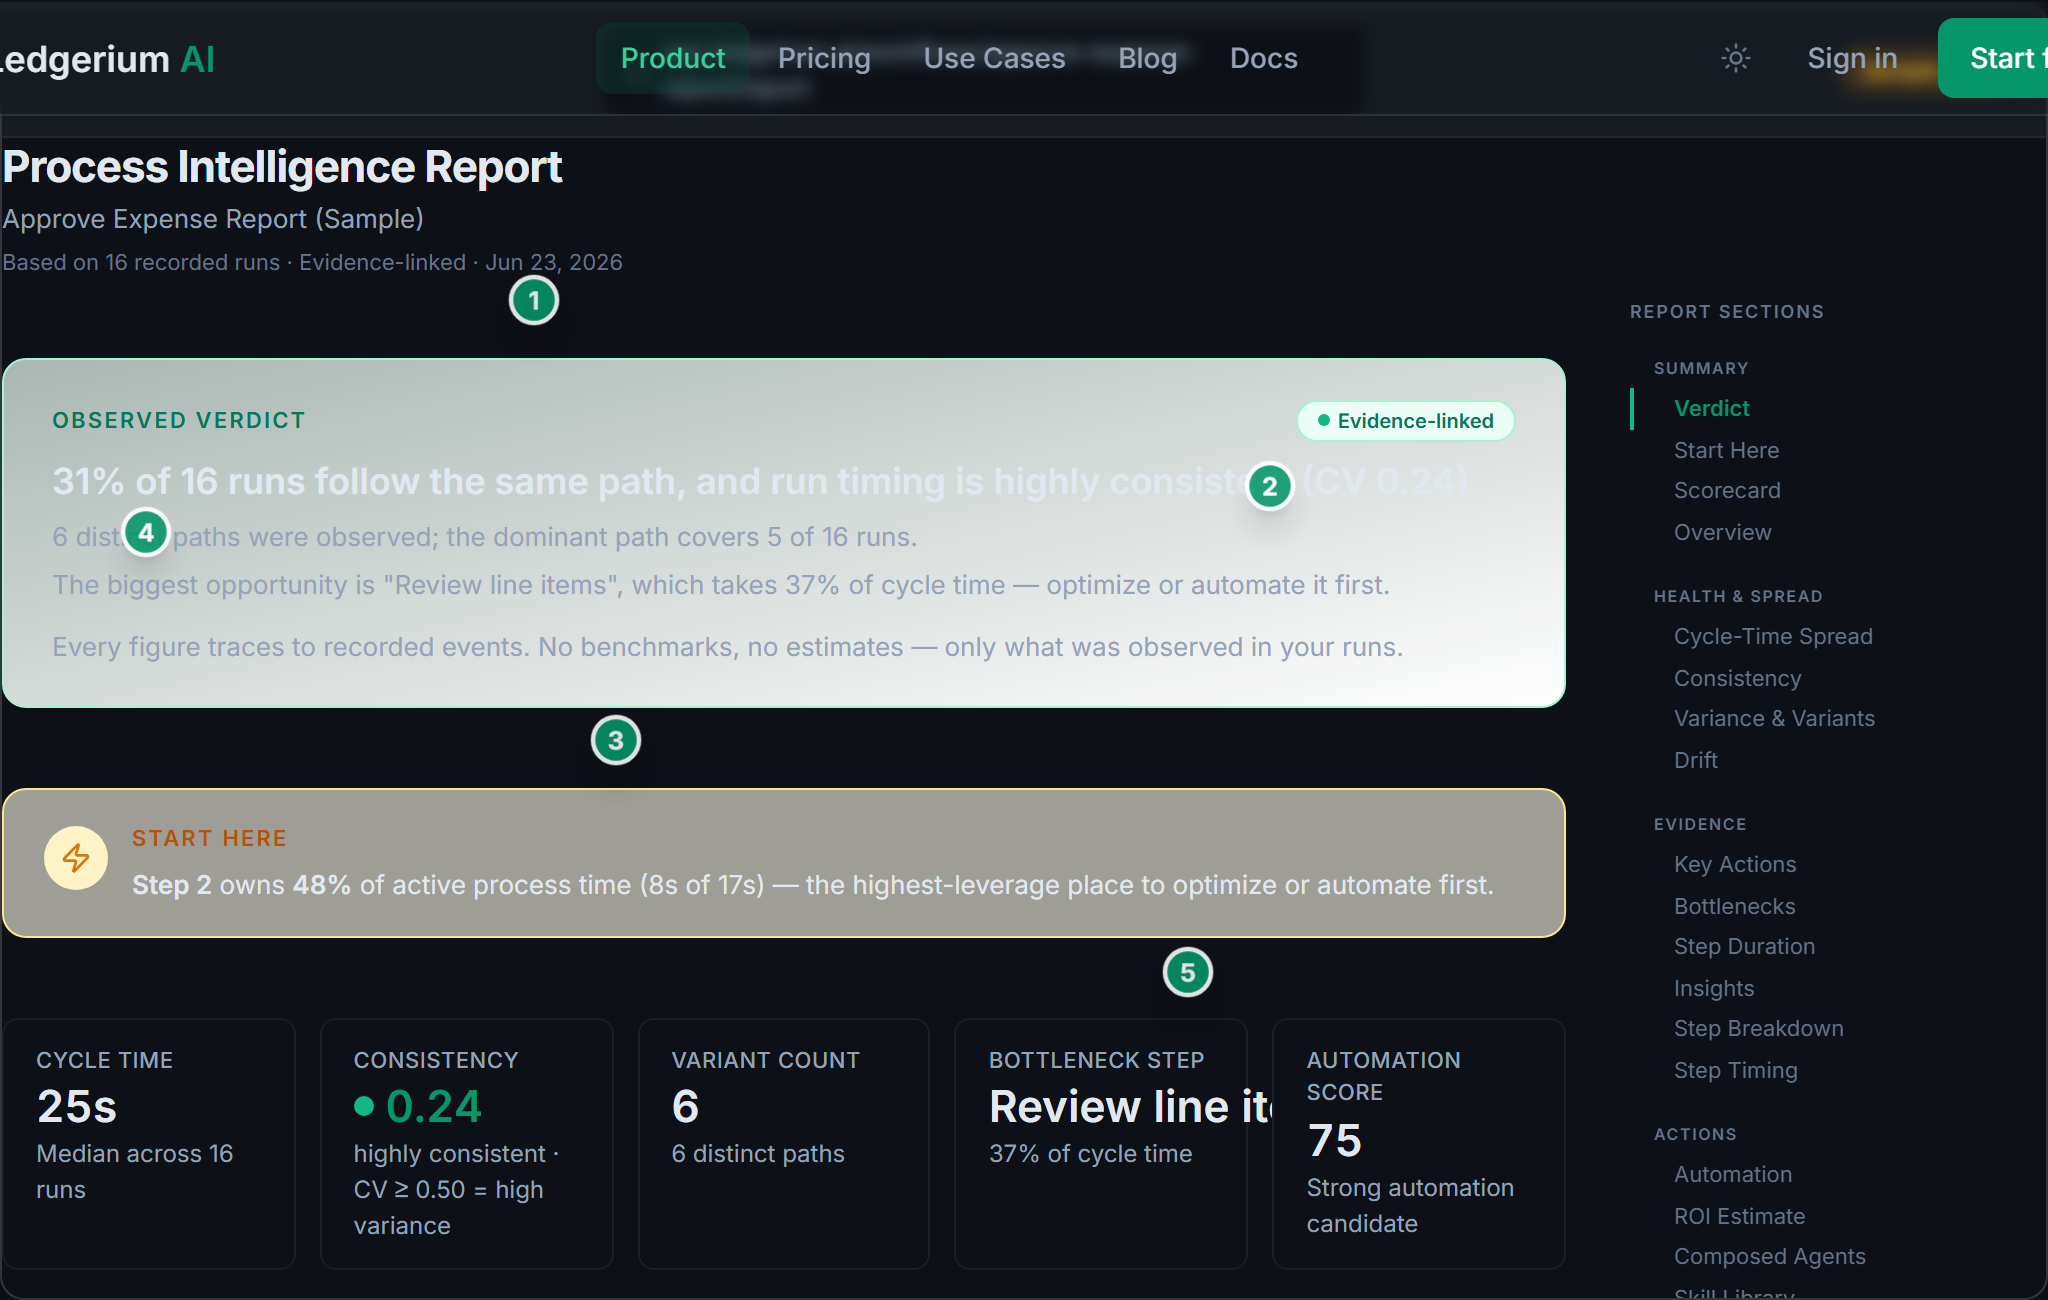
The report
Every recorded workflow produces a full quantitative report — scorecard, timestudy, bottlenecks, automation, ROI, and more. Scroll inside it, and click any numbered marker to learn what a section surfaces.
How it works
Four steps from browser recording to actionable process intelligence.
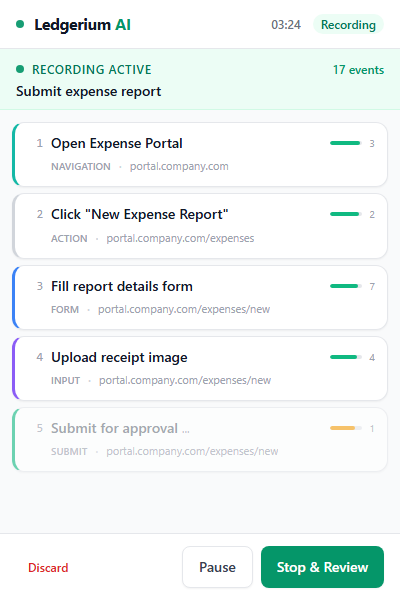
Record
Open the Ledgerium side panel in Chrome. Name your workflow and click Record. The extension captures every click, navigation, and form interaction as structured data.
A live step feed shows your progress. No screenshots, no keystrokes, no screen recording — just interaction structure.

See the process map
Click any workflow. The process map renders from observed transitions. Switch to the frequency overlay to see how often each path was actually taken, or Variants to compare how different runs diverged.
The map was measured, not drawn. The thick paths are the route most runs actually took — every edge is a real transition.
Get the SOP
Ledgerium generates a complete step-by-step SOP from the recording. Every step cites the events it came from — and you can ask the workflow a question and get an answer grounded in the captured evidence.
Ready-to-share documentation with prerequisites, system context, and expected outcomes — generated from what was observed, not from memory.


See the report
The report leads with a verdict, then a scorecard, a step-duration timestudy, and a before/after ROI estimate. Toggle steps as removed or automated to see the projected cycle time.
The ROI number is arithmetic over your own observed step durations — based on your real run history, not a consultant’s estimate.
Every recording produces
Workflow Library
Searchable and measured
Process Map
Observed transitions
SOP Document
Step-by-step, evidence-cited
Workflow Report
Verdict, scorecard and ROI
Intelligence Layer
Your library gets smarter with every recording
Individual recordings produce documentation. A growing library unlocks process intelligence — a portfolio timestudy baseline, health scores, bottleneck detection, variant analysis, and automation opportunity scoring.
Drill into any process to see step-level health, timing breakdowns, and rework patterns.
Process Health Scores
Deterministic 0-100 scores for completeness, confidence, complexity, and duration across every workflow.
Bottleneck & Friction Detection
Identify where time is lost, where errors happen, and where processes diverge from the expected path.
Variant & Rework Analysis
Compare how different people do the same process. See where variants emerge and which path is most efficient.
Before / After ROI
Compare a baseline recording against an improved one. Time saved and dollar ROI are computed from your own observed step durations — never a benchmark or an estimate.
Intelligence features available on Team and Growth plans
Built different
Ledgerium isn't another screen recorder or documentation tool. It captures the structure of your work — not screenshots, not video, not what you remember.
| Dimension | Ledgerium AI | Screenshot Tools | Process Mining | Manual Docs |
|---|---|---|---|---|
| Input method | Structured browser events | Screen captures / screenshots | System event logs (SAP, Salesforce) | Interviews, workshops, memory |
| Output type | Structured data + SOP + process map | Annotated screenshot walkthrough | Process flow from system logs | Text document (Notion, Confluence) |
| Reproducible | Yes — same recording, same output every time | No — depends on annotation | Partially — depends on log quality | No — depends on author |
| Evidence-linked | Every step traces to source events | No — screenshots are static images | Partial — linked to system logs only | No — based on recall |
| Privacy | No screenshots, no keystrokes | Captures screen content | Requires system API access | Depends on what is documented |
| Time to first output | Under 5 minutes | Under 5 minutes | 3-6 months (implementation) | Days to weeks |
| IT involvement | None — Chrome extension | None — browser extension | Required — system integration | None |
No screenshots
No screen recording ever
No keystrokes
Typed content is never captured
Reproducible
Same recording, same output
Evidence-linked
Every step traces to source
Get your first SOP in 60 seconds
Sign up free and explore a sample workflow immediately — no extension install required. When you're ready, record your own.
Free plan includes 5 recordings per month. No credit card required.